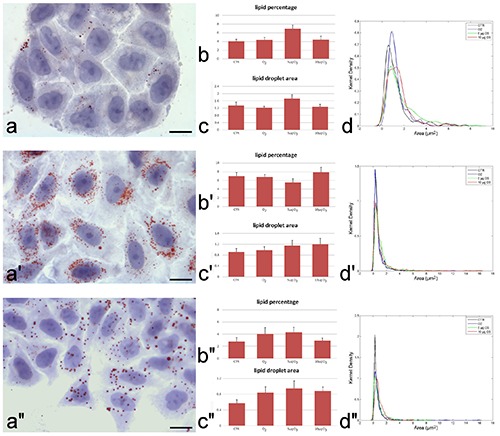
Figure 4.

Representative brightfield micrographs of hADAS cells grown in DMEM at day 6 (a), 16 (a’) and 20 (a’’). LDs were stained with Oil Red O and the cell was counterstained with haematoxylin. Note the increase of LDs at day 16 (a’) and the decrease at day 20. Scale bars: 20 μm. Mean values±SE of percentage of cytoplasmic area occupied by LDs (b-b’’) and of LD area (c-c’’) at 24 h post-treatment. No significant difference was found. Kernel distribution of LD area (d-d’’).
