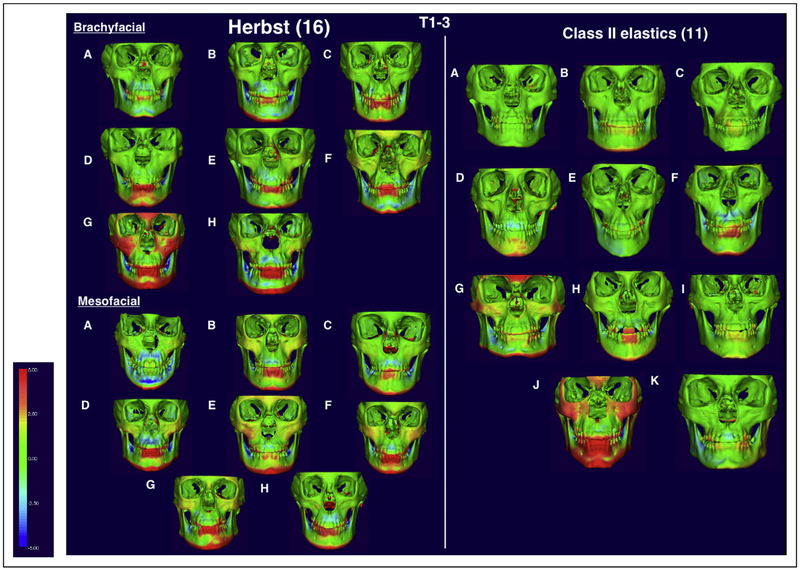
Fig 1.
Color maps showing skeletal displacements calculated from the 3D volume renderings for both Herbst groups and the Class II controls at T1 to T3 when registered and superimposed at the anterior cranial base. The color map scale is set from −5 to +5 mm. Red represents regions of anterior displacement of T3 in relation to T1; blue represents regions of posterior displacement.

