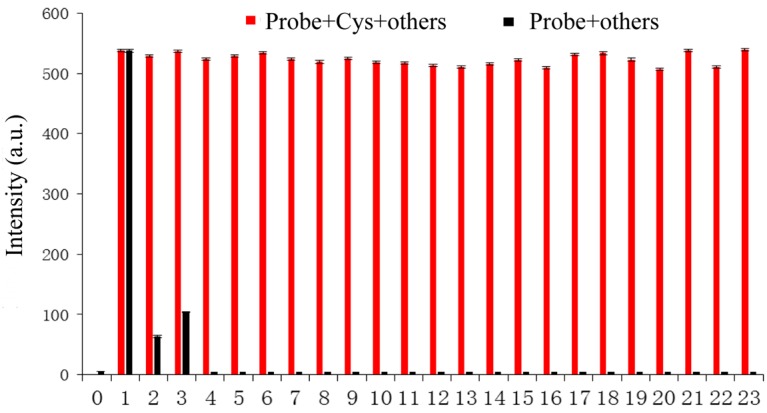
Figure 3.
Black bar represents the fluorescence response of the probe (10 μM) to various compounds (50 equiv.). Red bar represents the fluorescence response of the probe (10 μM) to Cys (50 equiv.) in the presence of other compounds (50 equiv.). Each reaction was in buffered solution (PBS:DMSO = 6:4, pH = 7.4) at room temperature. The numbers represent analytes: 0. Blank; 1. Cys; 2. Hcy; 3. GSH; 4. Asp; 5. Val; 6. Glu; 7. Pro; 8. Gly; 9. Phe; 10. Met; 11. Thr; 12. Ser; 13. Ile; 14. His; 15. Phe; 16. Lys; 17. Try; 18. Leu; 19. Cys C; 20. CN−; 21. SCN−; 22. HS−; 23. SO42−. λex = 325 nm, λem = 450 nm.

