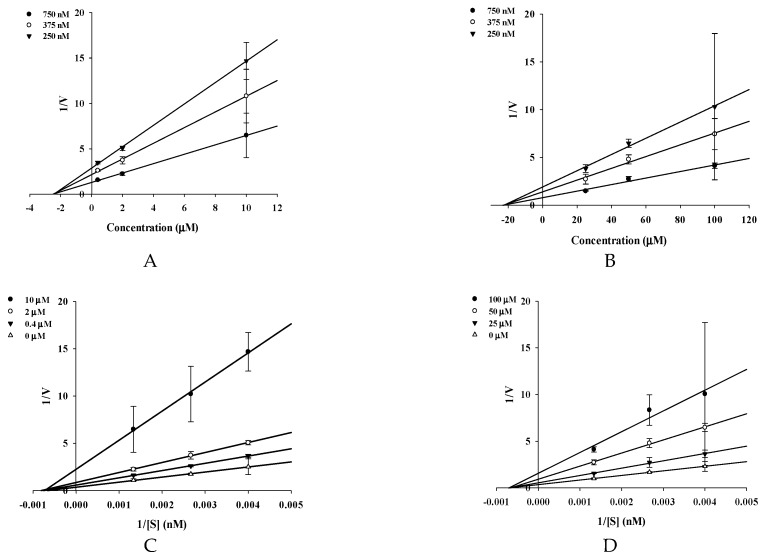
Figure 2.
Dixon plots for BACE1 inhibition of 2 (A) and 3 (B) were tested in the presence of different concentrations of substrate: 750 nM (●), 375 nM (○), 250 nM (▼). Lineweaver–Burk plots for BACE1 inhibition of compounds were analyzed in the presence of different concentrations of sample as follows: 0 µM (Δ), 0.4 µM (▼), 2 µM (○), 10 µM (●) for 2 (C); 0 µM (Δ), 25 µM (▼), 50 µM (○), 100 µM (●) for 3 (D).

