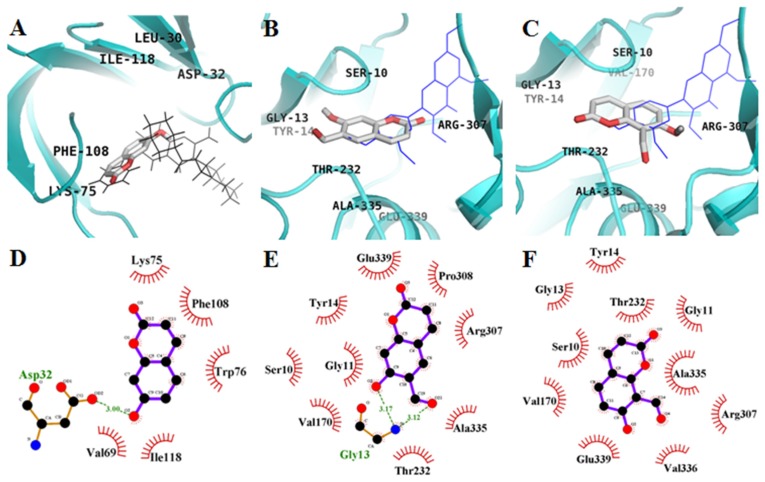
Figure 4.
Molecular docking models of BACE1 inhibition of 1 (A), 2 (B), and 3 (C) with QUD (black line) and PMF (blue line). Ligand interaction diagram of BACE1 inhibition of 1 (D), 2 (E), 3 (F). Dashed lines indicate hydrogen bonds. Carbons are in black, nitrogens in blue, and oxygens in red. Figures were generated using PyMOL and Ligplot+.

