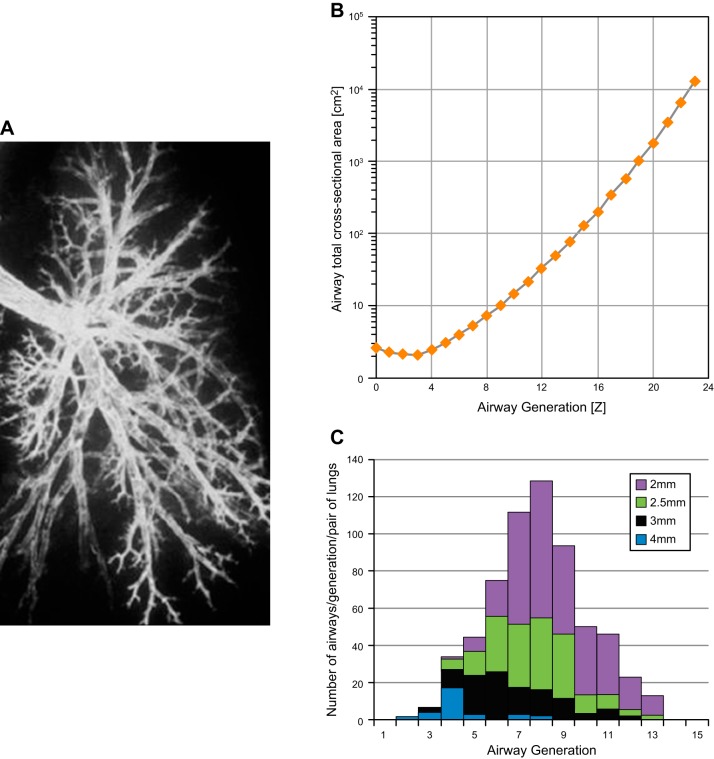
FIGURE 2.
A: bronchogram of a left lung to demonstrate the different pathway lengths to the periphery of the lung. B: distribution of airways of a given size in each generation of branching to demonstrate that each generation contains airways of several different sizes. [Data redrawn from Weibel (137).] C: total lumen cross-sectional area of all the branches decreases between generation 0–3 and then increases exponentially toward the periphery of the lung.

