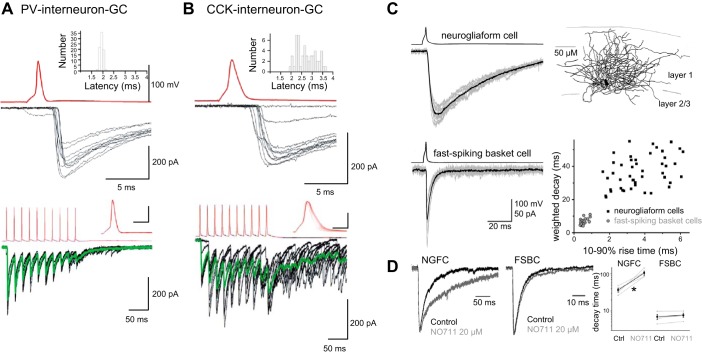
FIGURE 13.
The three modes of GABA release from PV-containing, CCK-containing and NGFC interneurons. A and B: superimposed IPSCs (black) evoked by single presynaptic action potentials (red) in a PV-containing interneuron-granule cell (GC) pair (A) and a CCK interneuron-granule cell pair (B). Insets: histograms of IPSC latency. A and B, bottom panels: superimposed IPSCs (black) evoked by trains of 10 action potentials (red) in a PV interneuron-granule cell pair (left) show a predominant synchronous mode of inhibitory output. In contrast, repetitive transmission in a CCK interneuron-granule cell pair (right) shows a large asynchronous component of transmission as the train proceeds. Green: average IPSCs. Insets: presynaptic action potentials aligned to the stimulus onset at expanded time scale (scale bars: 2 ms, 50 mV). C: GABAA IPSCs evoked by NGFCs (top right panel) are comparatively slower than those observed at FSBC synapses. Top: 10 consecutive IPSCs (gray) and their average (black) in a layer 2/3 PC after single action potentials in a layer 1 NGFC (top). Middle traces show equivalent IPSCs evoked by a layer 2 FSBC for comparison. Bottom right panel: comparison of the kinetics of postsynaptic responses evoked by NGFCs (black squares) and FSBCs (gray circles). Each point represents an individual connection. D: modulation of GABA responses evoked by NGFCs by GABA uptake. Fast IPSCs evoked from FSBC are not sensitive to the GABA uptake inhibitor NO711. In contrast, GABAA,slow IPSCs arising from NGFCs are markedly prolonged in the presence of NO711, demonstrating a differential sensitivity of the two modes of transmission to inhibition of GABA uptake. [A and B from Hefft and Jonas (477) with permission from Nature Neuroscience. C and D from Szabadics et al. (1074).]

