FIGURE 6.
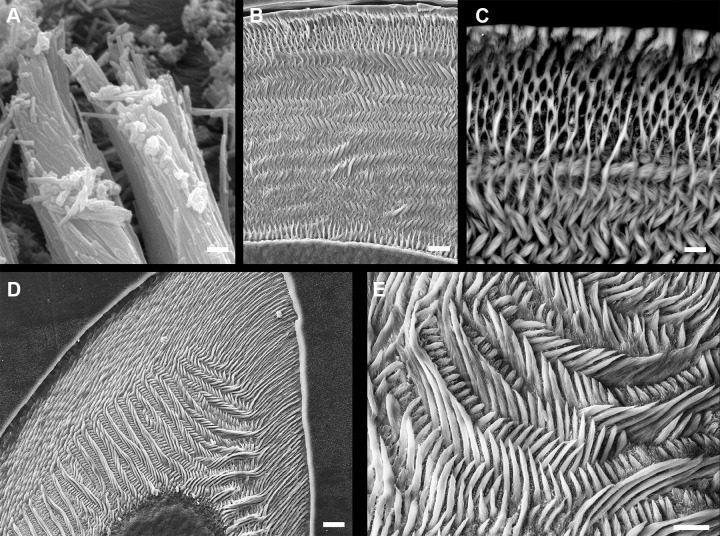
Scanning electron (SE) micrographs of mouse enamel. A: bundles of single Hap crystals can be seen forming tubular structures known as enamel prisms or enamel rods. Each ameloblast is responsible for the formation of one enamel rod. These rods are the basic structural units of enamel. The architectural patterning of the rods forms the microstructure. Scale = 2 μm. B: enamel microstructure in a cross section of a mouse incisor. Scale = 10 μm. C: close up of outer incisor enamel in back-scattered SE mode showing the change in organization of the rods as the Tomes’ process is lost (top of image). At this point, the enamel microstructure loses the rod-interrod patterning. Scale = 2 μm. D: mouse molar enamel (same animal as in A) showing the complexity of its microstructure which reflects the movement of ameloblasts and how different tooth types may vary in microstructure. Inner enamel reflects strong decussation (crossing of ameloblasts along various planes as they move) but in the outer enamel (top of image) ameloblasts move in straight paths. Scale = 10 μm. E: close up of inner enamel showing the strong decussation of the enamel rods in this tooth. Scale = 10 μm. (All SE images by Timothy G. Bromage and Rodrigo S. Lacruz.)

