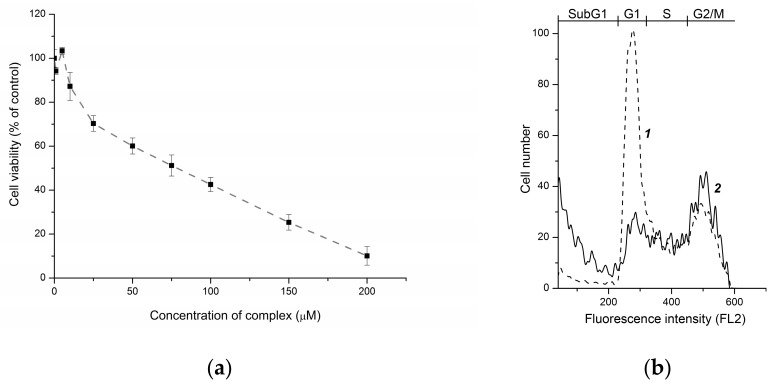
Figure 3.
Cell viability inhibition (a) and cell cycle changes (b) caused by ETM in A172 cells after 24 h exposure. A, the dose-effect curve. B, the histograms of propidium iodide DNA staining in the untreated (1) and ETM-treated cells (2); on the top, the cell cycle phases, as well as cell population with decreased DNA content (SubG1, dying cells) are marked.

