Figure 2.
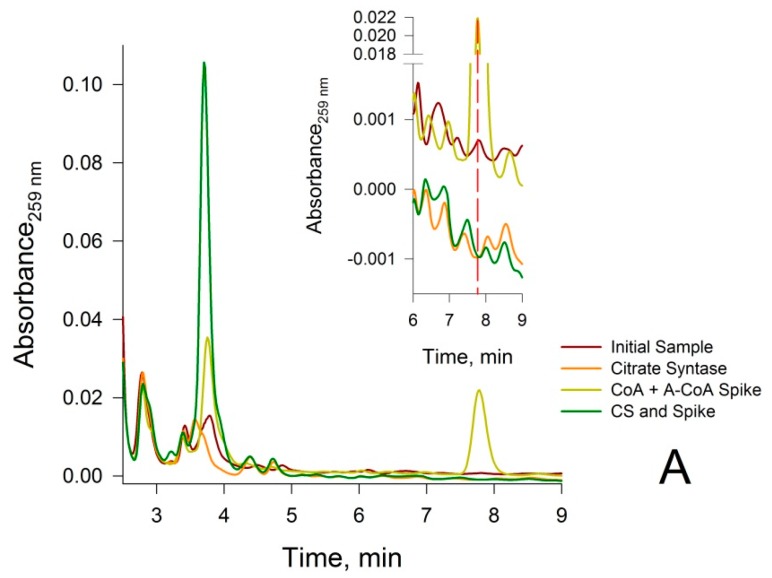
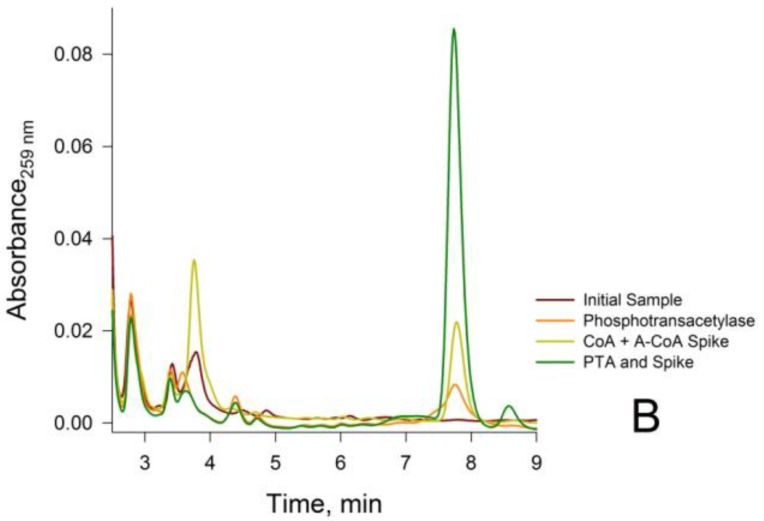
Confirmation of the identity of CoA and acetyl-CoA in the peaks eluting at 3.8 and 7.8 min, respectively, for neutralized deproteinized rat liver extracts. (A) Use of citrate synthase (CS) to confirm that the peak at 3.8 min is due to CoA. Brown trace: initial sample prior to treatment with CS and oxaloacetate; Orange trace: sample treated with CS and oxaloacetate for 5 min at 37 °C; Yellow trace: sample spiked with 10 µM CoA, 10 µM acetyl-CoA and oxaloacetate at zero time; Green trace: sample spiked with 10 µM CoA, 10 µM acetyl-CoA and oxaloacetate after incubation with CS for 5 min at 37 °C. Note that the magnitude of the CoA peak in the initial sample at the magnification shown is relatively small. The insert depicts an expanded scale shown for better resolution; (B) Use of phosphotransacetylase (PTA) to confirm that the peak at 7.8 min is due to acetyl-CoA. Brown trace: initial sample; Orange trace: sample after 5 min treatment at 37 °C with PTA and acetyl phosphate; Yellow trace: sample spiked with 10 µM CoA, 10 µM acetyl-CoA, PTA and acetyl phosphate at zero time; Green trace: spiked sample after incubation with PTA and acetyl phosphate for 5 min at 37 °C.


