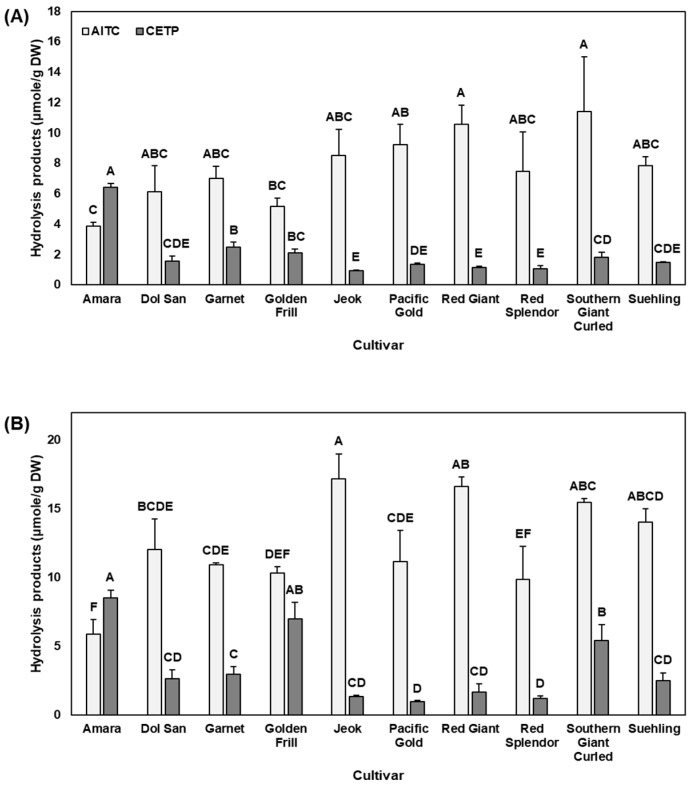
Figure 2.
AITC and CETP concentration of 11 mustard leaves at (A) baby leaf and (B) mature stages. Error bars indicate the standard error of the total hydrolysis product concentration (n = 3). Different letters above the error bars indicate significant difference in each hydrolysis product concentration among cultivars at each physiological stage by Tukey’s honest significant difference (HSD) at p ≤ 0.05. AITC, allyl isothiocyanate; CETP, 1-cyano-2,3-epithiopropane.

