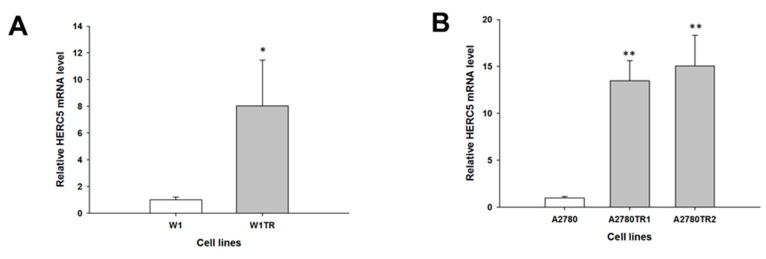
Figure 4.
Expression analysis (Q-PCR) of the HERC5 gene in: W1 (A); and A2780 TOP-resistant cell lines (B). The figure presents relative the gene expression in resistant cell lines (grey bars) with respect to the sensitive cell line (white bars), assigned as 1. The values were considered significant at * p < 0.05 and ** p < 0.01.

