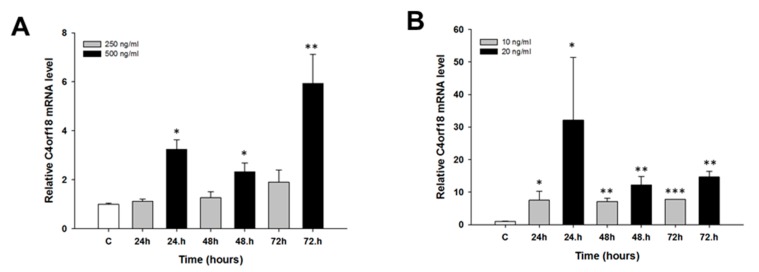
Figure 8.
Expression analysis of the C4orf18 gene in A2780 cell line. The figure presents the relative gene expression in: CIS-treated (A); and TOP-treated (B) cells (grey and black bars) with respect to the untreated control (white bars), assigned as 1. The values were considered significant at * p < 0.05, ** p < 0.01 and *** p < 0.001.

