An official website of the United States government
Here's how you know
Official websites use .gov
A
.gov website belongs to an official
government organization in the United States.
Secure .gov websites use HTTPS
A lock (
) or https:// means you've safely
connected to the .gov website. Share sensitive
information only on official, secure websites.

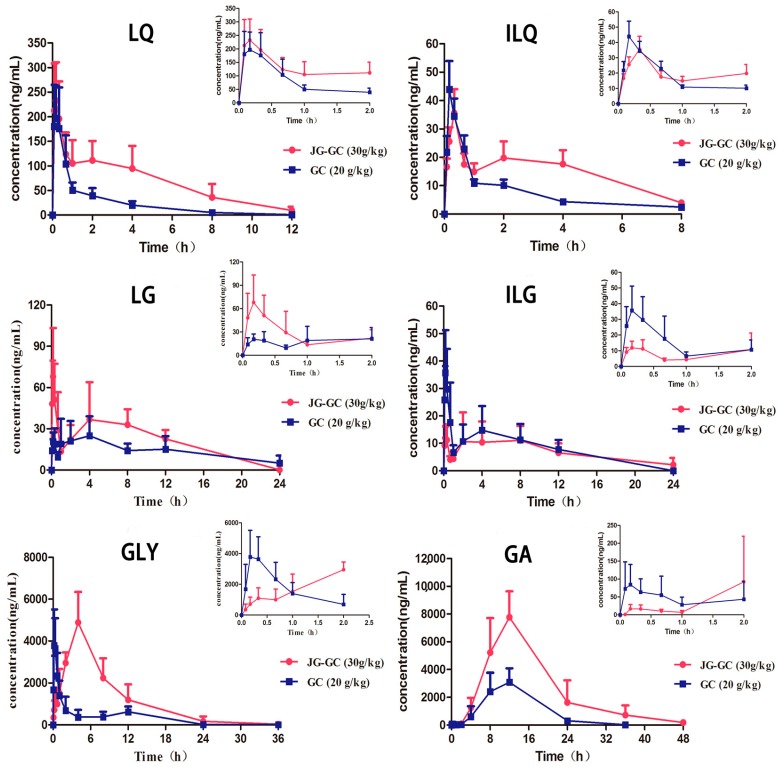
 ): JG–GC (30 g/kg, p.o.); Group 2 (
 ): GC (20 g/kg, p.o.). The upper right corner of each drug curve shows the corresponding drug profile within 2 h.