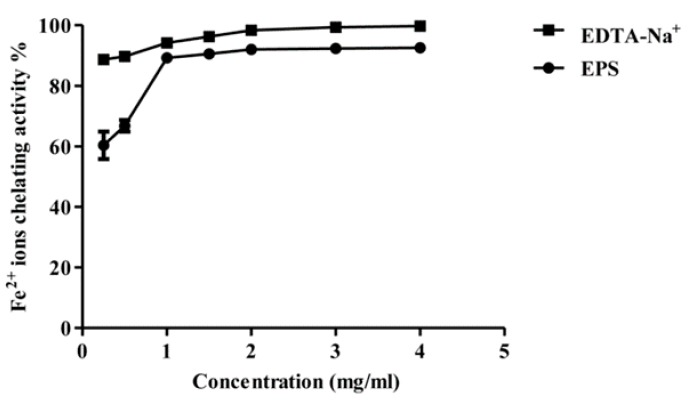
Figure 9.
Ferrous ion chelating activity of different concentrations of MOE6-EPS (0.25, 0.5, 1, 1.5, 2, 3, 4 mg/mL) from Streptomyces sp. MOE6 compared to that of EDTA-Na+ (0.25, 0.5, 1, 1.5, 2, 3, 4 mg/mL) as a positive control. Values are means ± SD (n = 3). 100% (w/v) Fe2+ was 111.6 μg/mL. The absence of error bars indicates that the errors were smaller than the symbols.

