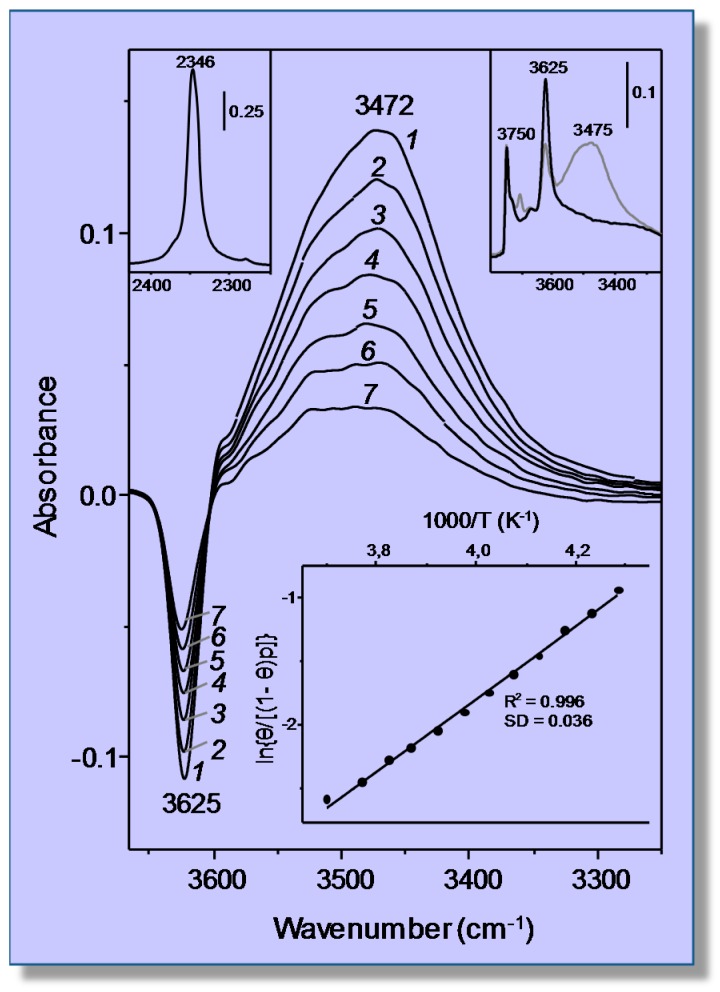
Figure 2.
Representative variable-temperature IR spectra (O−H stretching region) of CO2 adsorbed on H-MCM-22. The spectra are shown in the difference mode (zeolite blank subtracted). From 1–7, temperature goes from 233–275 K; and equilibrium pressure from 4.49–6.22 mbar. The top inset (right) shows the IR spectra in the O−H stretching region of the blank zeolite H-MCM-22 wafer (black line), and after dosing with CO2 at 77 K (gray line). The top inset (left) shows the asymmetric ν3(CO2) stretching region of Spectrum 1. The bottom inset shows the van ’t Hoff plot for CO2 adsorbed on H-MCM-22: data obtained from the O−H stretching band at 3625 cm−1. R, linear regression coefficient; SD, standard deviation.

