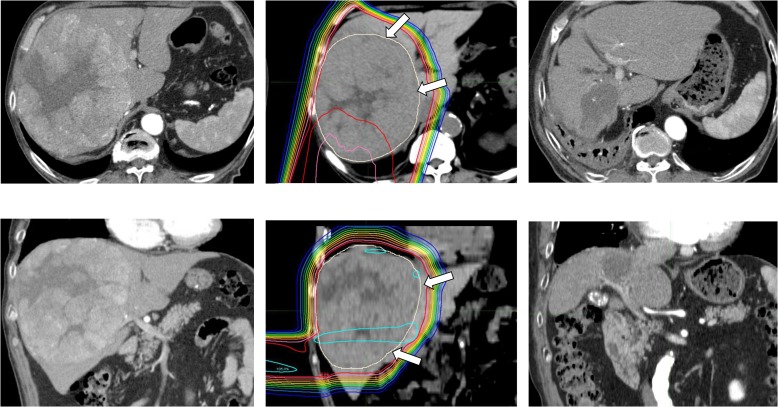
Fig. 4.
Dose distribution and computed tomography (CT) before and after PBT. Left: CT before PBT; middle: dose distribution; right: CT 14 months after PBT. Upper: axial image; lower: coronal image. Dose lines represent from 105 to 10% lines relative to the prescription dose from inside to outside. Arrows indicate the clinical target volume (CTV).

