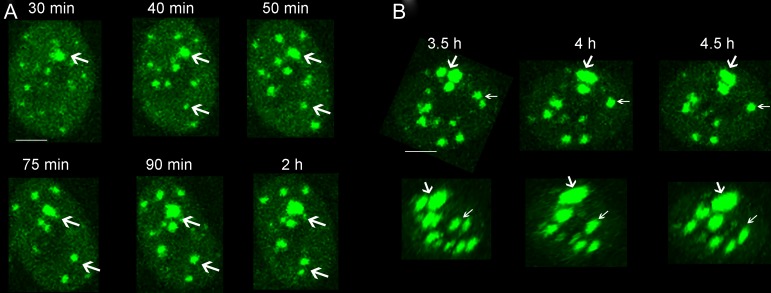
Fig. 4.
Different ways to increase the area of unrepaired IRIF in the IR+HT group. (A) Representative time-lapse images show the growth in individual IRIF area in situ (white arrows). Bar = 5 μm. (B) Representative images of the merging of adjacent IRIF in the x–y plane (upper panel) and x–z plane (lower panel). White arrows show the clustering process of the proximal IRIF. Bar = 5 μm.

