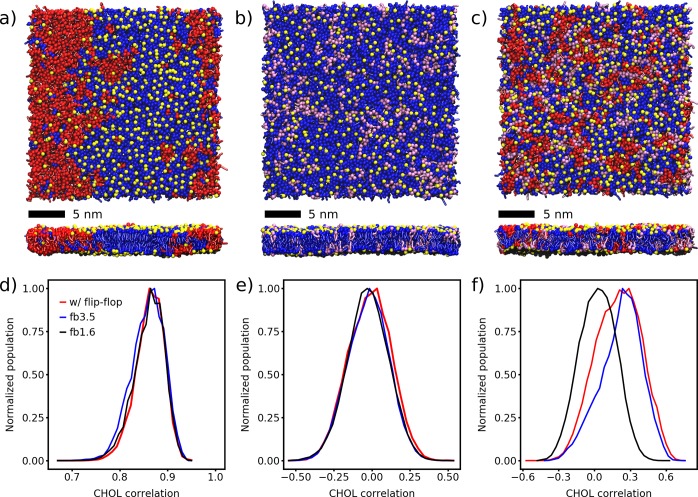
Figure 1.
Lipid mixtures of DPPC/DLiPC/CHOL (a,d), DPPC/DOPC/CHOL (b,e), and DPPC/DOPC/DLiPC/CHOL (c,f). (a–c) Top and side views of the membrane organization after 30 μs of simulation without any restrictions on CHOL. DPPC, blue; DOPC, purple; DLiPC, red; CHOL, yellow. The phospholipid headgroups are omitted for clarity. (d–f) Distributions of the Pearson correlation of the CHOL densities of the two leaflets evaluated for the last 20 μs of the simulations. Snapshots were taken every 500 ps without averaging.

