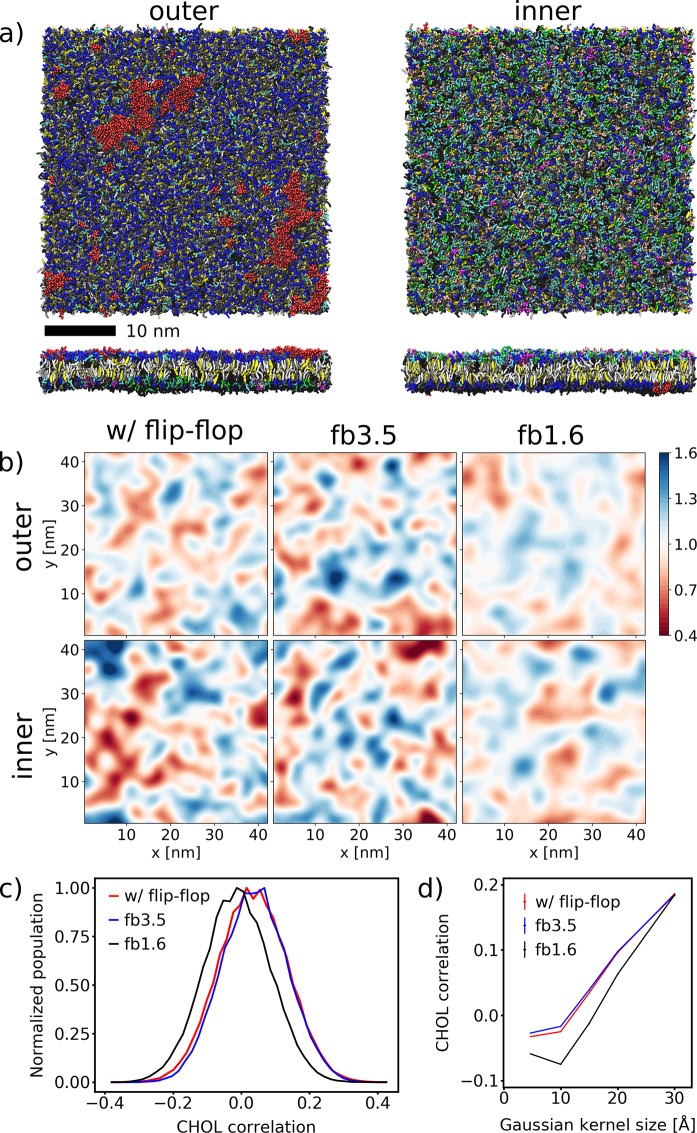
Figure 2.
Final snapshot of the average PM simulated with CHOL flip-flop at 100 μs. (a) Top and side views of the membrane organization. The lipids are colored according to their headgroups: PC, blue; PE, cyan; SM, gray; PS, green; glycolipids, red; PI, pink; PA, white; PIPs, magenta; CER, ice blue; DAG, brown; CHOL, yellow. (b) Snapshot of the final CHOL density calculated with a Gaussian kernel of σ = 15 Å. (c) Distributions of the Pearson correlation of the CHOL densities of the two leaflets evaluated for the last 80 μs of the simulations. Snapshots of the CHOL densities were taken every 500 ps without averaging. (d) Mean Pearson correlation depending on the Gaussian kernel size σ used to calculate the CHOL density.

