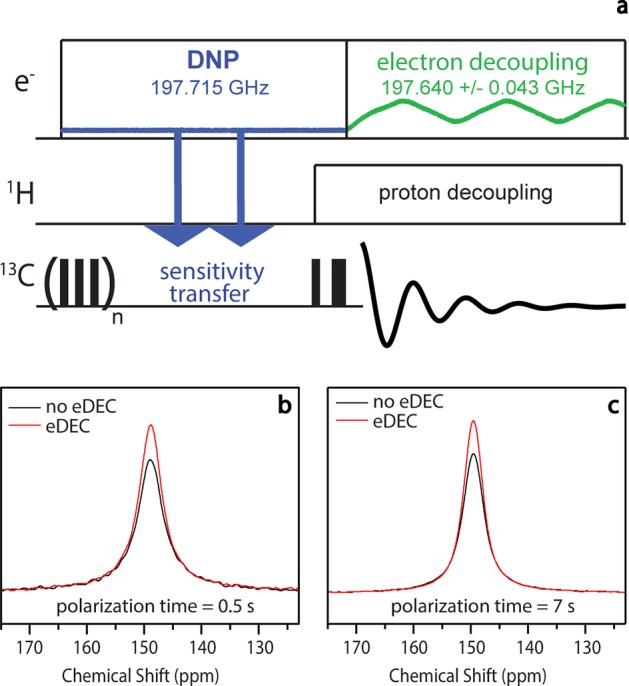
Figure 4.

(a) 13C Hahn-Echo pulse sequence used to demonstrate pulsed eDEC. (b) Pulsed eDEC performed with a polarization time of 0.5 s. The line width is narrowed from 419 to 371 Hz with pulsed eDEC: a narrowing of 48 Hz. (c) Pulsed eDEC performed with a polarization time of 7 s. The line width is narrowed from 336 to 309 Hz with pulsed eDEC: a narrowing of 27 Hz. Black spectra represent the 13C signal obtained with no eDEC, while red spectra represent those obtained with pulsed eDEC. The sample is 4 M (U–13C,15N) urea and 40 mM trityl (Finland radical) in d-8 glycerol/D2O/H2O (60/30/10 by volume) at a sample volume of 30 μL in a 3.2 mm zirconia rotor. The experiments were conducted at 90 K and at a sample spinning frequency of 4 kHz. Figure reproduced with modifications by permission of the Journal of the American Chemical Society.45
