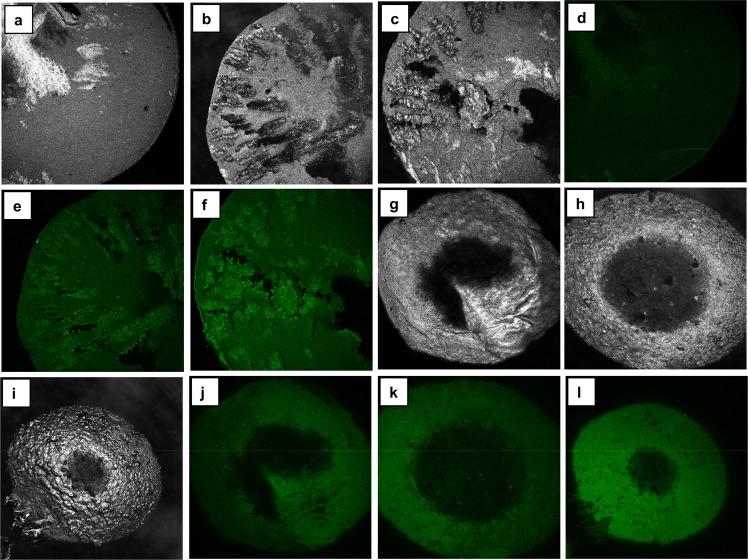
Figure 17.
Distribution of lignin in cellulose (C)–lignin (L) beads as examined by confocal fluorescence microscopy. Cross section of the beads in the reflection channel: (a) 90C10L, (b) 75C25L, and (c) 60C40L. Surface of the beads in the reflection channel: (g) 90C10L, (h) 75C25L, and (i) 60C40L. Cross sections in the fluorescence channel: (d) 90C10L, (e) 75C25L, and (f) 60C40L. Surface in the fluorescence channel: (j) 90C10L, (k) 75C25L, and (l) 60C40L. The colors of the images are artificial. The parameters for all the fluorescent images were adjusted in the same way during processing. Reprinted from ref (113) with permission from Springer.

