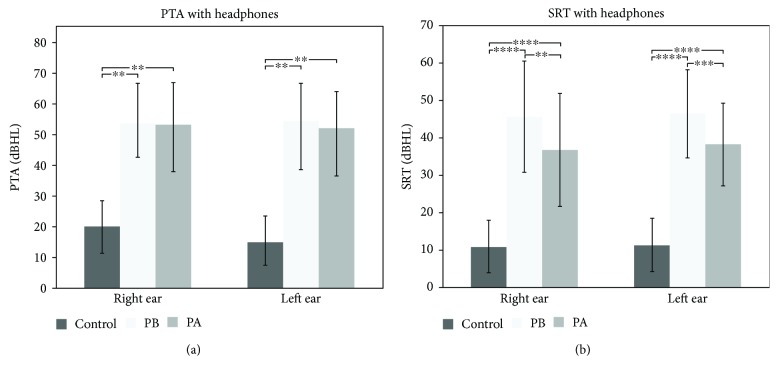
Figure 1.
(a) PTA and (b) SRT with headphones of the control group, the patients before HA use (PB), and patients after HA use (PA). (a) Mean and standard deviations are shown for right and left ears. Results of PTA with headphones revealed statistical differences (∗∗ p < 0.001) in both ears between the CG and PB and PA. When comparing the PB with the PA, statistically significant difference was observed only for the left ear (∗ p < 0.04). (b) SRT results with headphones demonstrated statistically significant results between PB and PA for the right ear (∗∗ p < 0.001) and for the left ear (∗∗∗ p < 0.002). Moreover, statistical analysis indicated significant differences between the GC and PB and PA (∗ p < 0.0001, for both ears).

