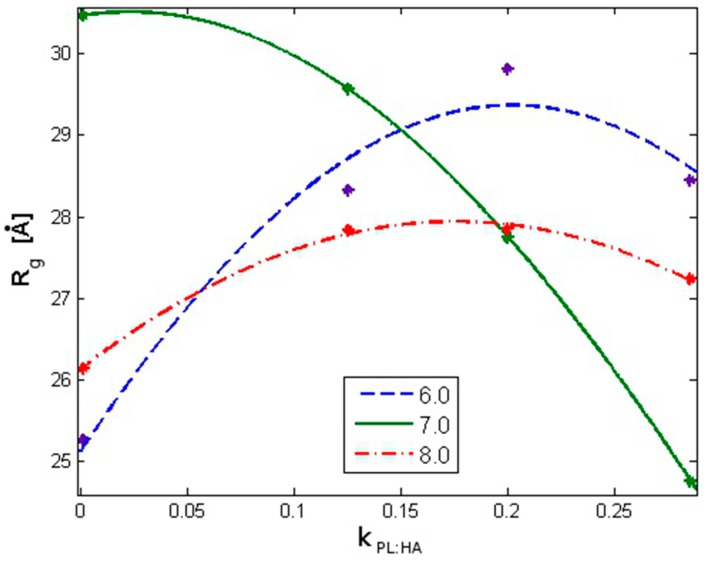
Figure 4.
The average HA radius of gyration as a function of DPPC concentration defined as the mass ratio . The lines represent Gaussian function fitting to mean values (represented by stars). The fitting parameters are presented in Table 1. The legend indicates pH values.

