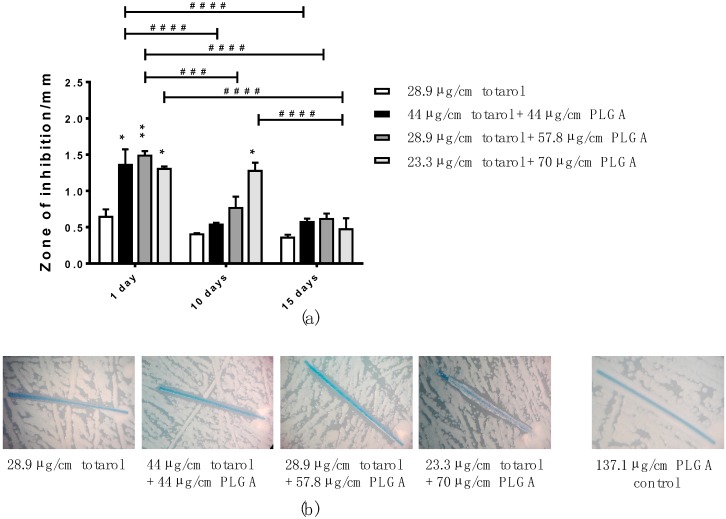
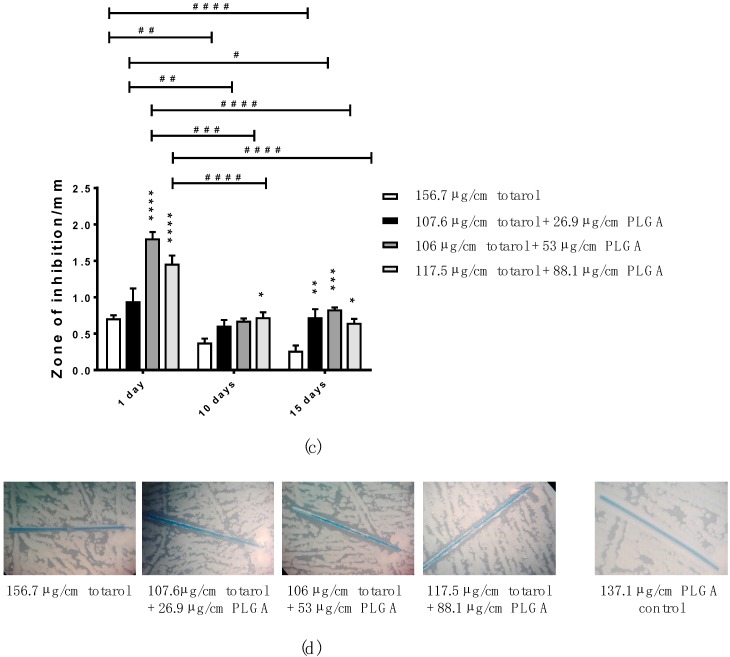
Figure 4.
(a) Bar graph showing the differences in the zones of inhibition, arising during the Agar Diffusion Test (ADT), of monofilament sutures coated with a 25 mg/mL totarol stock solution and different concentrations of PLGA at days 1, 10 and 15 (n = 3); (b) Representative images demonstrating a similar zone of inhibition after 15 days in all four groups. As the negative control, a PLGA-only-coated suture is shown; (c) Bar graph depicting the change in zones of inhibition around monofilament sutures sprayed with a coating solution with a concentration of 100 mg/mL totarol and varying amounts of PLGA at days 1, 10 and 15 of the ADT (n = 3); (d) Representative images of the zones of inhibition of sutures coated in the four stock solutions at day 15. As the negative control, a PLGA-only-coated suture is shown. Data are given as means with SEM. Two-way RM ANOVA followed by Tukey’s multiple comparisons test was used to identify significant differences. Asterisks (* p < 0.05, ** p < 0.01, *** p < 0.001, and **** p < 0.0001) indicate statistical significances between the diverse coatings and the control (totarol coating without PLGA). Hashes (# p < 0.05, ## p < 0.01, ### p < 0.001, and #### p < 0.0001) indicate statistical significance between the equal coating solutions at the various time points.


