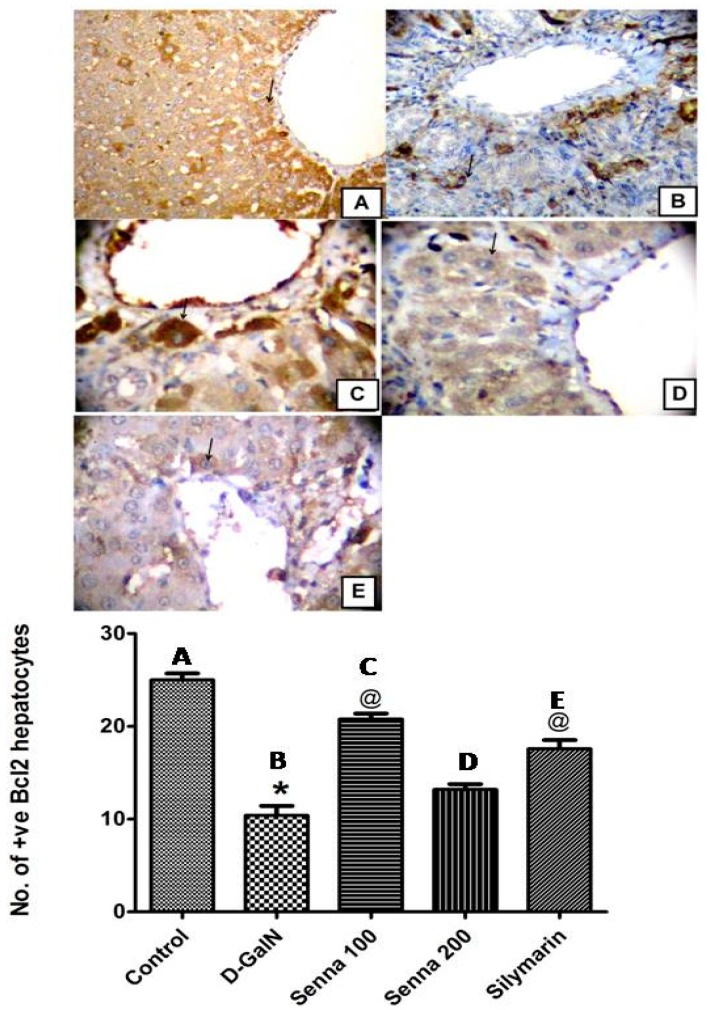
Figure 7.
Bcl-2 expression measured by immunohistochemistry in paraffin-embedded liver tissues and stained with Avidin-biotin peroxidase stain with haematoxylin counter stain, original magnification (400×). (A): A liver section of an adult rat of control group showing strong positive cytoplasmic Bcl-2 immunoreaction (arrow); (B): A liver section of an adult rat of d-GalN group, showing weak cytoplasmic immunoreaction for Bcl-2 (arrow); (C): A liver section of an adult rat pre-treated with the bark extract (100 mg/kg) followed by d-GalN showing strong positive cytoplasmic immunoreaction for Bcl-2 (arrow); (D): A liver section of an adult rat pre-treated with the bark extract (200 mg/kg) followed by d-GalN group showing moderate cytoplasmic immunoreaction for Bcl-2 (arrow); (E): A liver section of an adult rat pre-treated with silymarin (100 mg/kg) followed by d-GalN showing moderate cytoplasmic immunoreaction for Bcl-2 (arrow). Five fields per group were randomly selected and analysed. Graph included with the images reveals morphometric analysis for the mean number of hepatocytes for each corresponding group which are positive to Bcl-2; statistical difference was detected using One Way ANOVA followed by Tukey’s post hoc test. * Significantly different from control group at p < 0.05, @ Significantly different from d-GalN group at p < 0.05.

