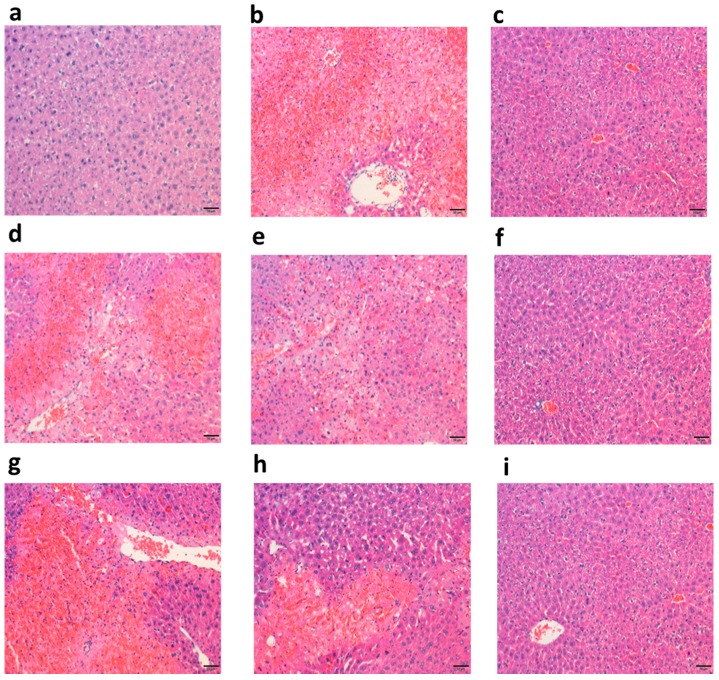
Figure 5.
Effects of DRP1 and DRP2 on histopathological changes in liver tissues (magnification 200×). (a) liver of mice in the NC group; (b) liver of mice in the model control (MC) group; (c) liver of mice in the positive control (PC) group; (d–f) liver of mice injected with DRP1 at dosage of 50, 100 and 200 mg/kg; and (g–h) liver of mice injected with DRP2 at dosage of 50, 100 and 200 mg/kg, respectively.

