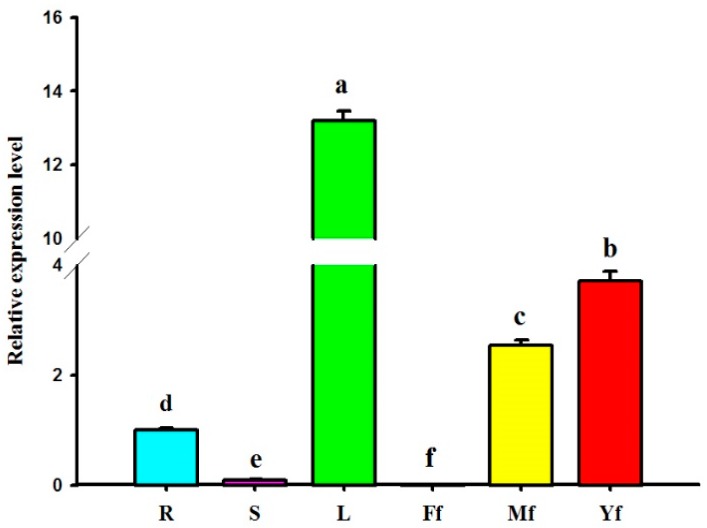
Figure 6.
Spatial expression analysis of GbHMGS1 in various tissues of G. biloba. R: root; S: stem; L: leaf; Ff: female flower; Mf: male flower; Yf: young fruit. The gene expression level of GbHMGS1 in root was set to 1. Data are mean ± SD from triplicate experiments (n = 3). Means with different letters are significantly different at p < 0.05.

