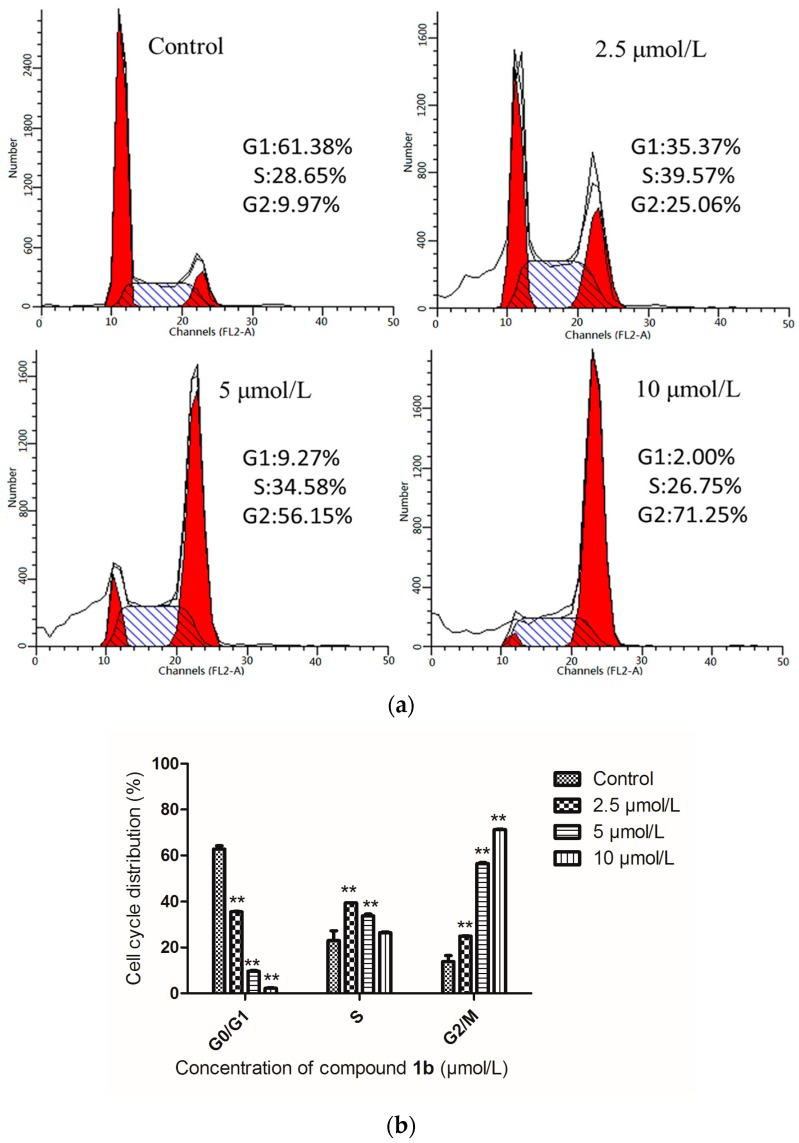
Figure 3.
(a) Effects of compound 1b on the cell cycle progression of HepG-2 cells were determined by flow cytometry analysis. HepG-2 cells were treated with different concentrations of compound 1b for 24 h. The percentage of cells in each cycle phase is indicated (left red for G1, center shadow for S, light red for G2); (b) Cell cycle distribution of HepG-2 cells. Compared with the corresponding control group, ** p < 0.01, (n = 3).

