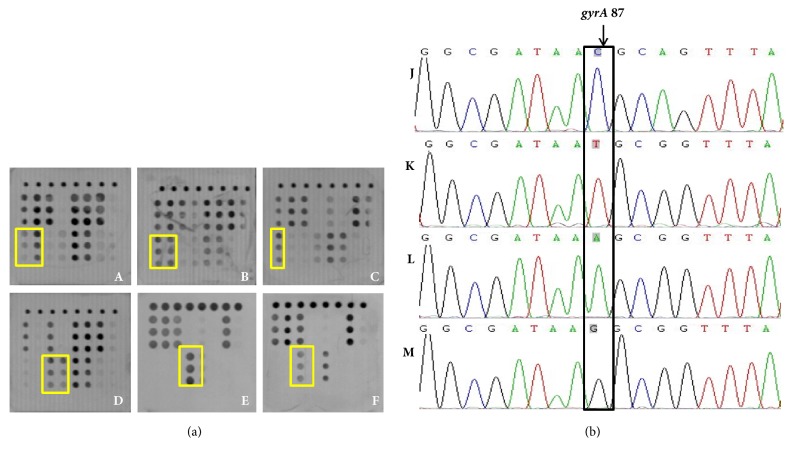
Figure 7.
(a) Microarray detection results of gyrA at Asn-87 (indicating by yellow frame): A, B, and C were wild genotype T/C; D, E, and F were mutation genotype A/G. (b) Sequencing results of gyrA at Asn-87 (indicating by black frame): J was wild genotype C, K was wild genotype T, L was mutation genotype A, and M was mutation genotype G.

