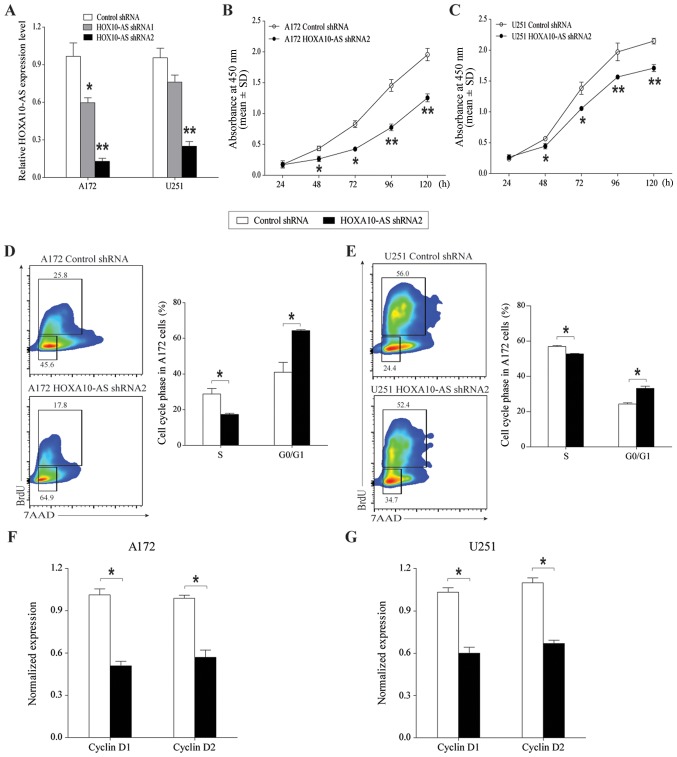
Figure 2.
Effects of HOXA10-AS-knockdown on glioma cell growth. (A) HOXA10-AS was stably silenced in A172 and U251 cells by transfection of shRNA. HOXA10-AS RNA expression was determined by quantitative polymerase chain reaction. GAPDH served as an internal control. (B and C) Following knockdown of HOXA10-AS, A172 and U251 cell growth curves were determined by MTT assay. The total number of control cells increased ~10-fold over 5 days, whereas the total number of cells with silenced HOXA10-AS increased ~5-fold over 5 days. (D and E) Representative flow cytometric cell-cycle profiles demonstrating a G0/G1 arrest and a decreased number of S-phase HOXA10-AS-knockdown cells, compared with control cells. BrdU was added to cells for 4 h, and then flow cytometry was used to analyze cell proliferation and cell cycle distribution. (F and G) Downregulation of cyclin D1 and cyclin D2 expression in HOXA10-AS-knockdown cells was determined by quantitative polymerase chain reaction. GAPDH served as an internal control. Error bars represent the standard error of the mean of three independent experiments. *P<0.05 and **P<0.01 by Student's t-test.

