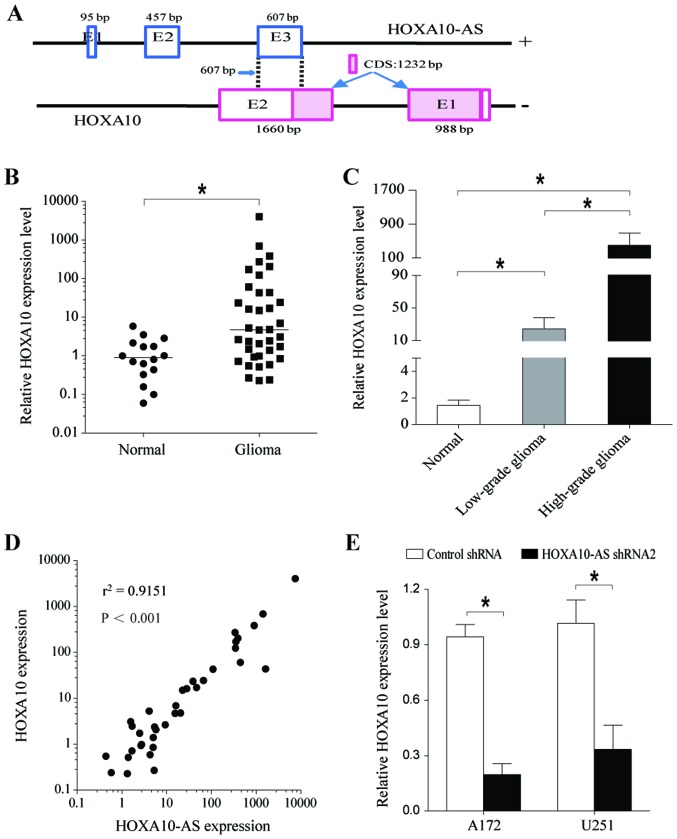
Figure 4.
HOXA10-AS promotes HOXA10 gene expression. (A) Exon composition of the HOXA10-AS transcript and organization of the overlapping exon with HOXA10. qPCR analysis of relative HOXA10 mRNA levels in normal brain tissues, low-grade glioma tissues and high-grade glioma tissues. (B) HOXA10 was upregulated in glioma tissues. (C) HOXA10 expression in high-grade glioma was greater than in low-grade glioma. (D) Spearman's correlation analysis demonstrated that the expression of HOXA10-AS and HOXA10 were positively correlated in glioma tissues. (E) HOXA10 expression was significantly decreased following knockdown of HOXA10-AS, compared with the control group in A172 and U251 cells by qPCR. GAPDH served as an internal control. Error bars represent the standard error of the mean of three independent experiments. *P<0.05 by Student's t-test. qPCR, quantitative polymerase chain reaction.

