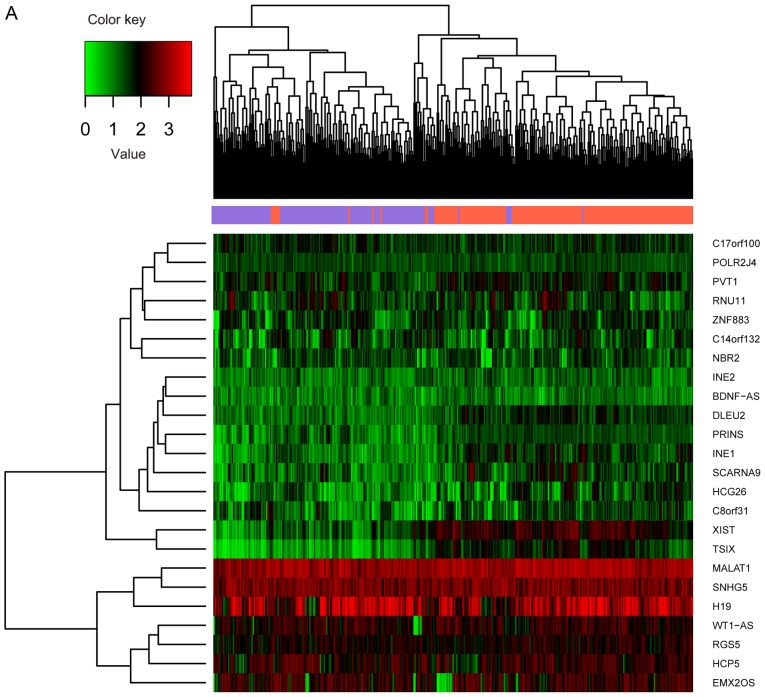
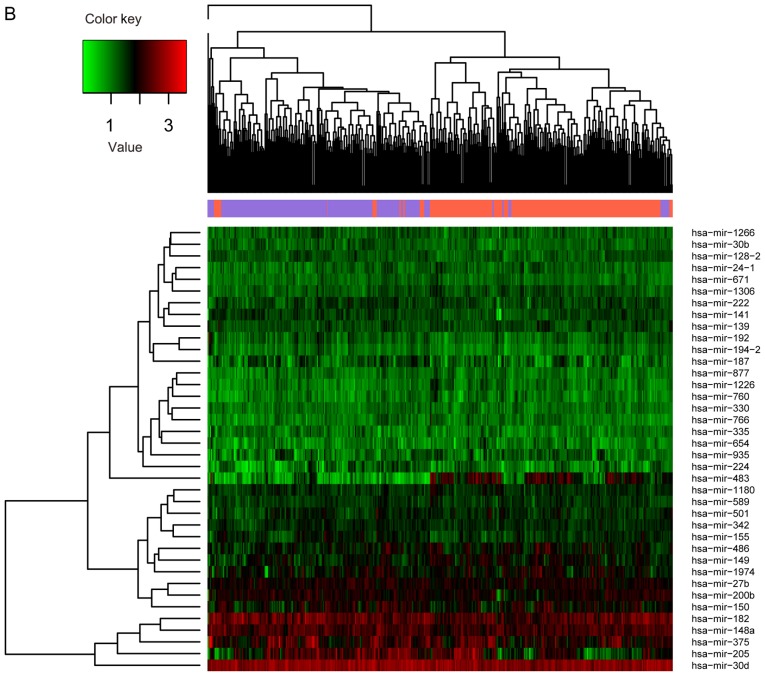
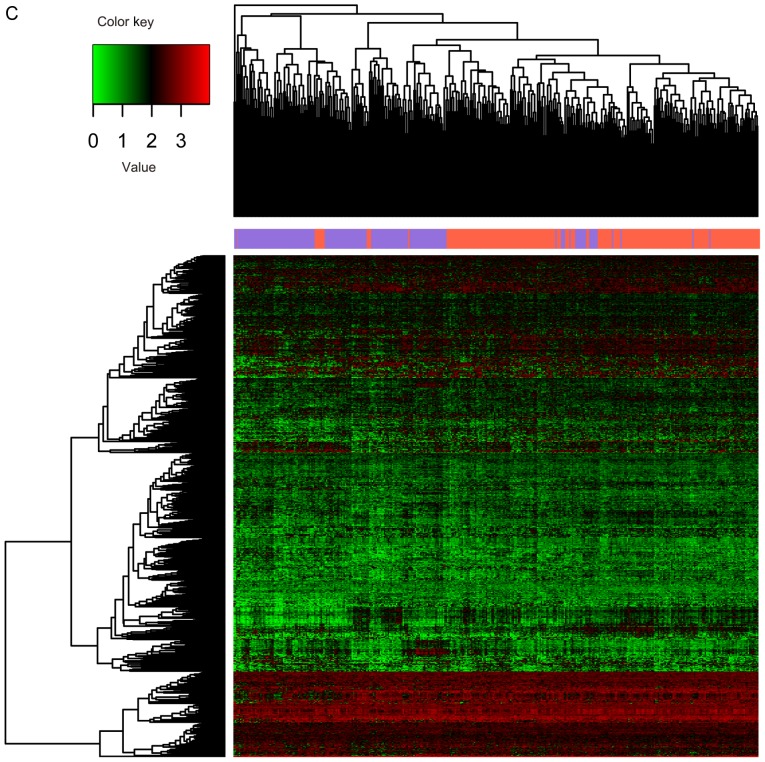
Figure 2.
Expression of different RNAs in different samples. (A) lncRNAs; (B) miRNAs. The y-axis represents RNAs; red denotes upregulation and green denotes downregulation. (C) mRNAs. The x-axis denotes the samples; the purple indicates the non-recurrent ovarian cancer, and the orange indicates the recurrent ovarian cancer. The y-axis represents RNAs; red denotes upregulation and green denotes downregulation.


