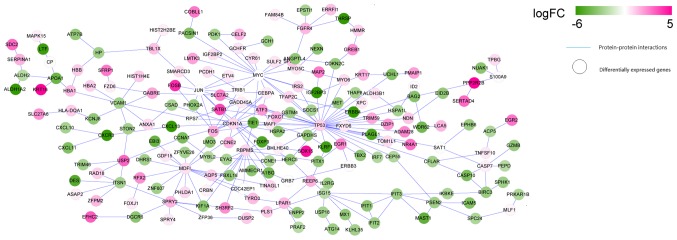
Figure 4.
Protein-protein interaction network of the differentially expressed genes. Pink denotes upregulated genes, and green denotes downregulated genes. The shade of color indicates different changes in expression; FC, fold change. The circle nodes denote genes and the lines denote the protein-protein interactions.

