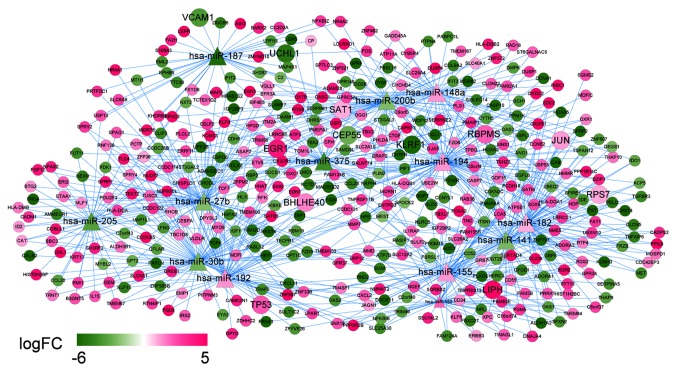
Figure 9.
DEM-DEG network in recurrent ovarian cancer. Diamonds denote miRNAs, circles denote target genes and larger circles denote genes belonging to the optimal feature gene set. Pink denotes upregulation and green denotes downregulation. The shade of color indicates different changes in expression; FC, fold change.

