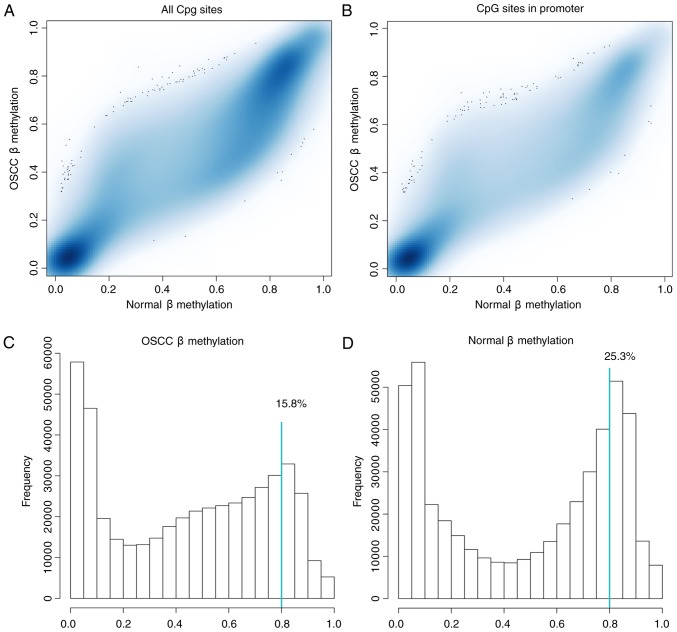
Figure 1.
β-methylation distribution. (A) β-values of the 461,304 CpG sites. The vertical axis indicates the methylation β-value of CpG sites in the OSCC samples and the horizontal axis indicates the methylation β-value of the CpG sites of the normal control samples. (B) β-methylation in the promoter region. The vertical axis represents the methylation β-value of the CpG sites in the promoter region of the OSCC sample, and the horizontal axis represents the methylation β-value of the CpG sites in the normal control samples. (C) Histogram representing the β-value distribution in different bins in OSCC samples. (D) Histogram representing the β-value distribution in different bins in normal samples. OSCC, oral squamous cell carcinoma.

