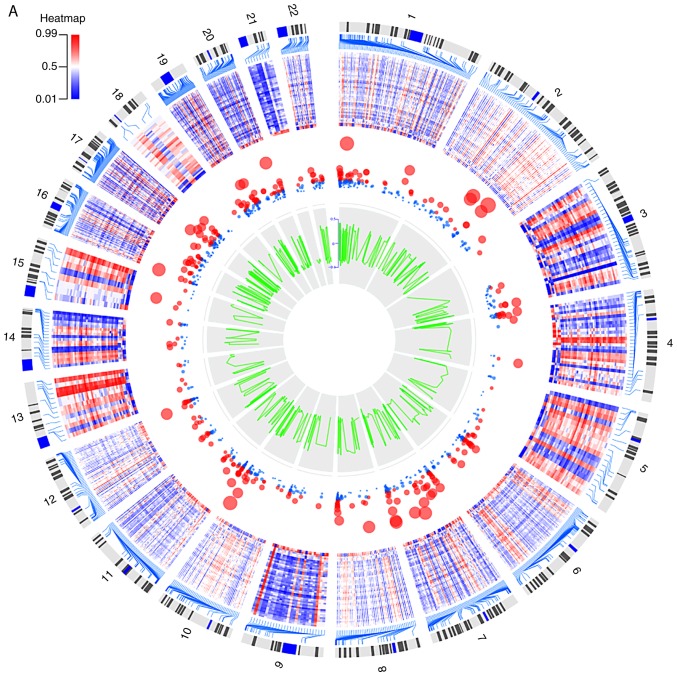
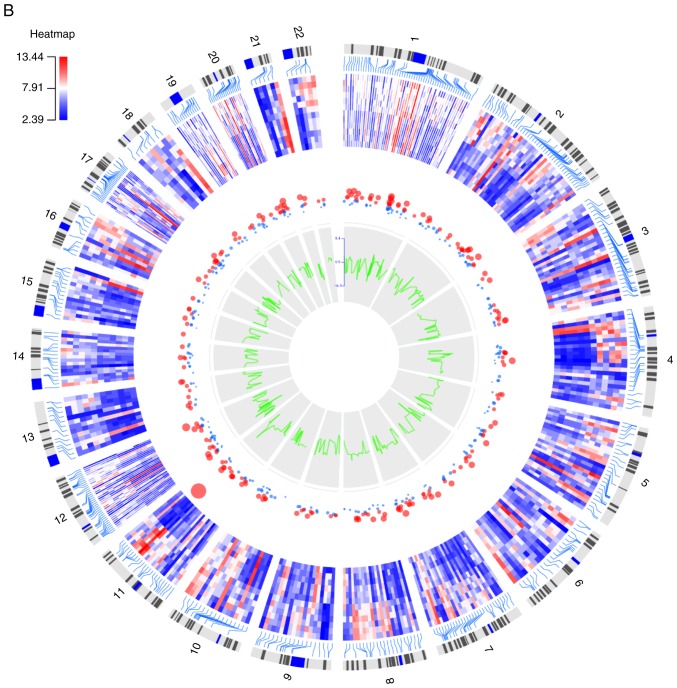
Figure 3.
Circular plots of (A) the top 1,000 differentially methylated CpG sites and (B) the differentially expressed genes. The tracks from outside to inside are the genome positions by chromosomes, heatmap, adjusted P-value (larger nodes indicate smaller adjusted P-values), and ∆β or log2fold-change. Colors from green to red correspond to low to high expression values.


