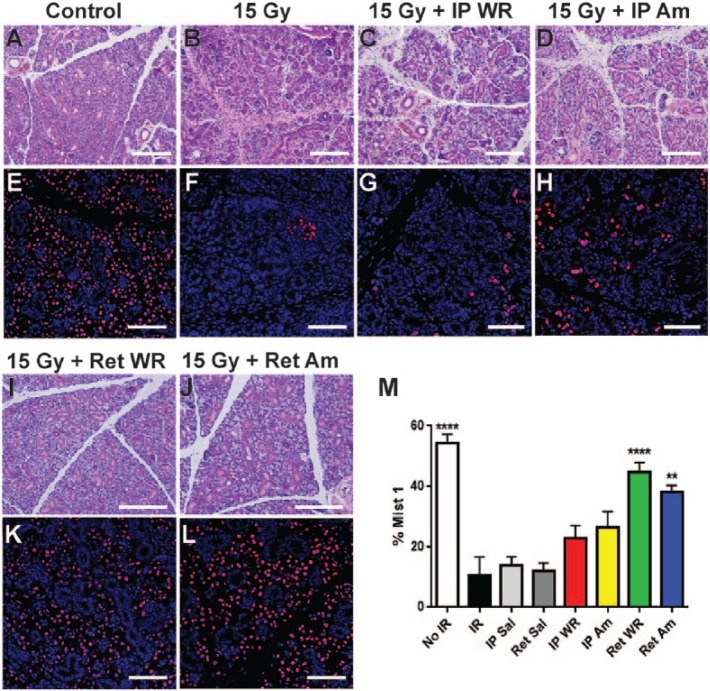
Figure 3.
Gland histology and Mist1 immunofluorescence at 12 weeks postirradiation. (A–D, I, J) Hematoxylin and eosin staining shows gross morphology of acini and ducts in submandibular gland at 12 wk after IR (scale bars = 200 μm). (E–H, K, L) Corresponding immunofluorescence shows nuclei stained with antibody to Mist-1 (red) in acinar cells with nuclear counterstain (DAPI) at 12 wk after IR (scale bars = 75 μm). Quantification of acinar cell areas is shown (M). Mean ± SEM, n = 5, ****P < 0.0001, **P < 0.01 versus IR, IP Saline (Sal), and Ret Sal, using 1-way analysis of variance with Tukey’s post hoc test for multiple comparisons. Am, amifostine; IP, intraperitoneal; IR, irradiation; Ret, retroductal; Sal, saline; WR, WR-1065.

