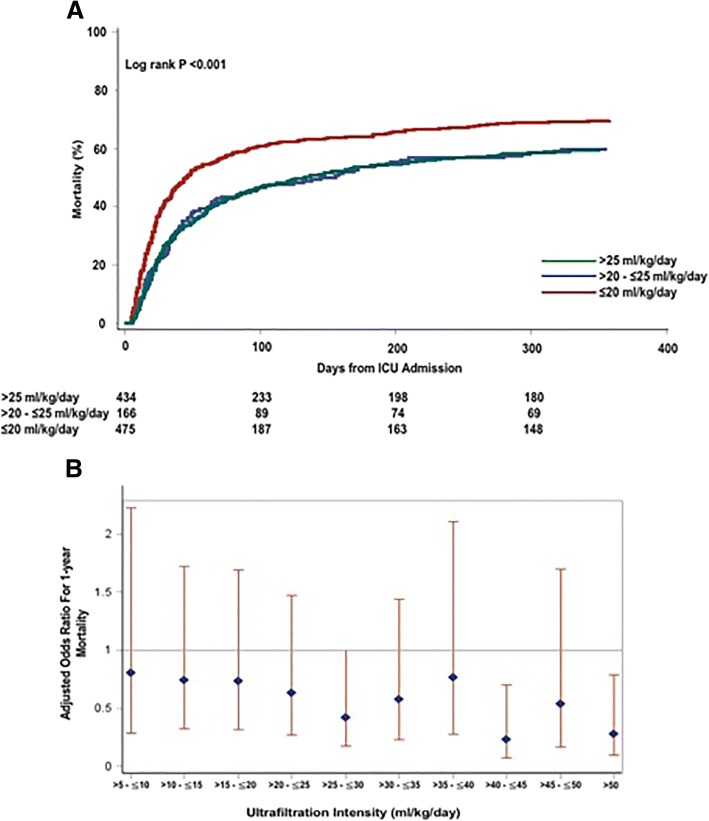
Fig. 1.
a. Association between net ultrafiltration intensity and time to mortality. Kaplan–Meier failure plots by UFNET intensity for probability of death over 1 year from ICU admission in overall cohort (n = 1075). Red line, low-intensity UFNET (≤ 20 ml/kg/day); blue line, moderate-intensity UFNET (> 20 to ≤ 25 ml/kg/day); green line, high-intensity UFNET (> 25 ml/kg/day). Probability of death highest in low-intensity compared with moderate and high-intensity UFNET groups (log-rank p < 0.001). b. Association between net ultrafiltration intensity and risk-adjusted 1-year mortality. Shown are adjusted odds ratio with 95% CI for association between UFNET intensity and mortality. Increasing UFNET intensity associated with trend toward lower mortality. Odds ratios adjusted for differences in age, sex, race, BMI, history of liver disease and sequela from liver disease, admission for liver transplantation, admission for surgery, baseline glomerular filtration rate, Acute Physiology and Chronic Health Evaluation III score, presence of sepsis, use of mechanical ventilation, percentage of cumulative fluid overload before initiation of RRT, oliguria before initiation of RRT, time to initiation of RRT from ICU admission, MAP on first day of RRT initiation, cumulative vasopressor dose and cumulative fluid balance during RRT, first RRT modality and duration of RRT. ICU intensive care unit

