Fig. 2.
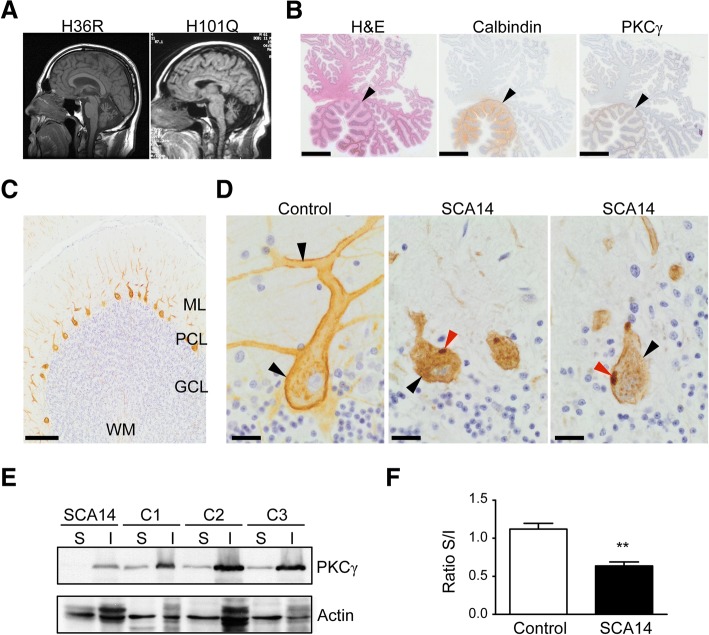
Cerebellar pathology in SCA14. a Brain MRI imaging of SCA14 patients carrying the H36R and H101Q mutations, respectively, shows marked cerebellar atrophy. b Neurodegeneration of SCA14 cerebellum. There is severe loss of Purkinje cells from the lateral neocerebellum. Purkinje cells in the tonsil (and flocconodular lobe) are relatively preserved (black arrowheads). Brain sections were stained with hematoxylin and eosin (H&E) (left panel), and with antibodies against Calbindin-28 k (centre) and PKCγ (right panel). Scale bar: 5 mm. c Normal PKCγ pattern from an age-matched control cerebellum. ML: molecular layer, PCL: Purkinje cell layer, GCL: granule cell layer, WM: white matter. Scale bar: 200 μm. d PKCγ staining of control (left) and SCA14 cerebellum (centre and right panels). In control cerebellum, PKCγ showed distinct expression at the plasma membrane, both around the soma and primary and secondary dendrites (black arrowheads), with minor granular staining in the perinuclear cytoplasm. In SCA14 cerebellum, homogeneous circumferential plasmalemma localization was lost (black arrowheads) and large cytoplasmic PKCγ aggregates were found, some apparently still linked to fragments of plasma membrane (red arrowheads). Scale bar: 20 μm. e, f Enrichment of mutant PKCγ in the Triton-X-100-insoluble fraction in SCA14 cerebellum compared to controls. Cerebellar tissue lysates were separated into Triton-X-100-soluble (S) and -insoluble (I) fractions. Equal volumes of soluble and insoluble fractions were loaded for SDS-PAGE and analyzed by immunoblotting for PKCγ. (e). Actin: loading control. The intensity of the bands was quantified and the level of PKCγ was normalized against the loading control. The ratio of normalized PKCγ present in the soluble versus insoluble fractions (Ratio S/I) is shown (n = 3, **p < 0.01, unpaired students’ t-test). (f). S: Triton-X-100-soluble fraction, I: Triton-X-100-insoluble fraction

