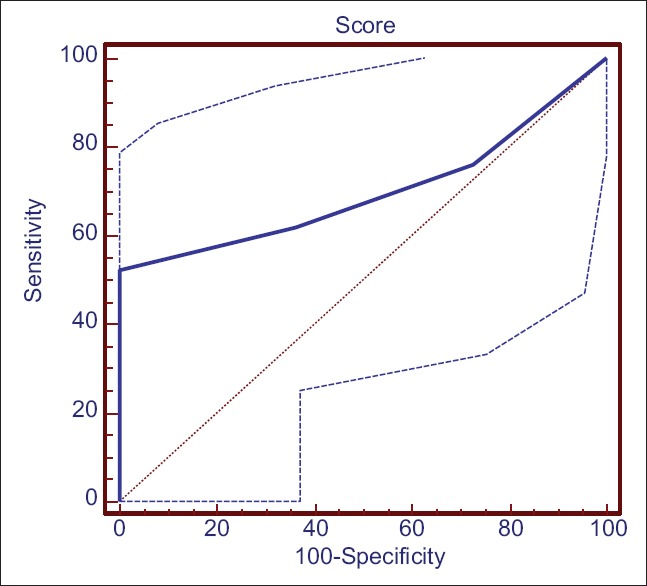
Figure 3.

ROC curve of patients with MS and score of ≥6 out of 10. The ROC curve on subgroup analysis of MS patients showed that a score of 6 or more had a high likelihood of predicting type II, III, or IV Mirizzi's, which was suggestive of fistulization into the bile duct with CI (29.8–74.3) with a sensitivity of 52.4% and a specificity of 100% (P= 0.05)
