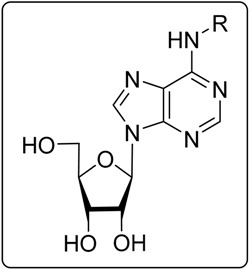
Table 2.
Antiviral effect of N6-substituted adenosines on the replication of the EV71 strain BrCr in RD cells.

| No. | Compound Name | Substituent (R) | CC50 ± SD a,b | EC50 ± SD a,b | SI с |
|---|---|---|---|---|---|
| 1 |
N6-benzyladenosine (BAPR) |
 |
4.3 ± 1.6 | 0.28 ± 0.05 | 15 |
| 2 |
N6-isopenthenyladenosine (iPR) |
 |
6.0 ± 0.6 | 1.0 ± 0.2 | 6.0 |
| 3 |
N6-furfuryladenosine (KINR) |
 |
7.8 ± 3.4 | 1.4 ± 0.3 | 5.6 |
| 5 | N6-(2-fluorobenzyl) adenosine |  |
13.3 ± 3.7 | 0.30 ± 0.05 | 44 |
| 6 | N6-(3-fluorobenzyl) adenosine |  |
6.2 ± 1.8 | 0.24 ± 0.09 | 26 |
| 7 | N6-(4-fluorobenzyl) adenosine |  |
2.7 ± 0.9 | 0.14 ± 0.05 | 19 |
| 8 | N6-(2,6-difluorobenzyl) adenosine |  |
>254 | 0.21 ± 0.01 | >1210 |
| 9 | N6-(2-trifluoromethylbenzyl) adenosine |  |
>235 | 1.0 ± 0.1 | >235 |
| 10 | N6-(3-trifluoromethylbenzyl) adenosine |  |
>235 | 0.068 ± 0.001 | >3456 |
| 11 | N6-(4-trifluoromethylbenzyl) adenosine |  |
>235 | 1.0 ± 0.1 | >235 |
a All values are in μM and are based on at least three independent dose-response curves; b On rhabdomyosarcoma (RD) cells; c Selectivity Index (SI); SI = CC50/EC50; SD, standard deviation.
