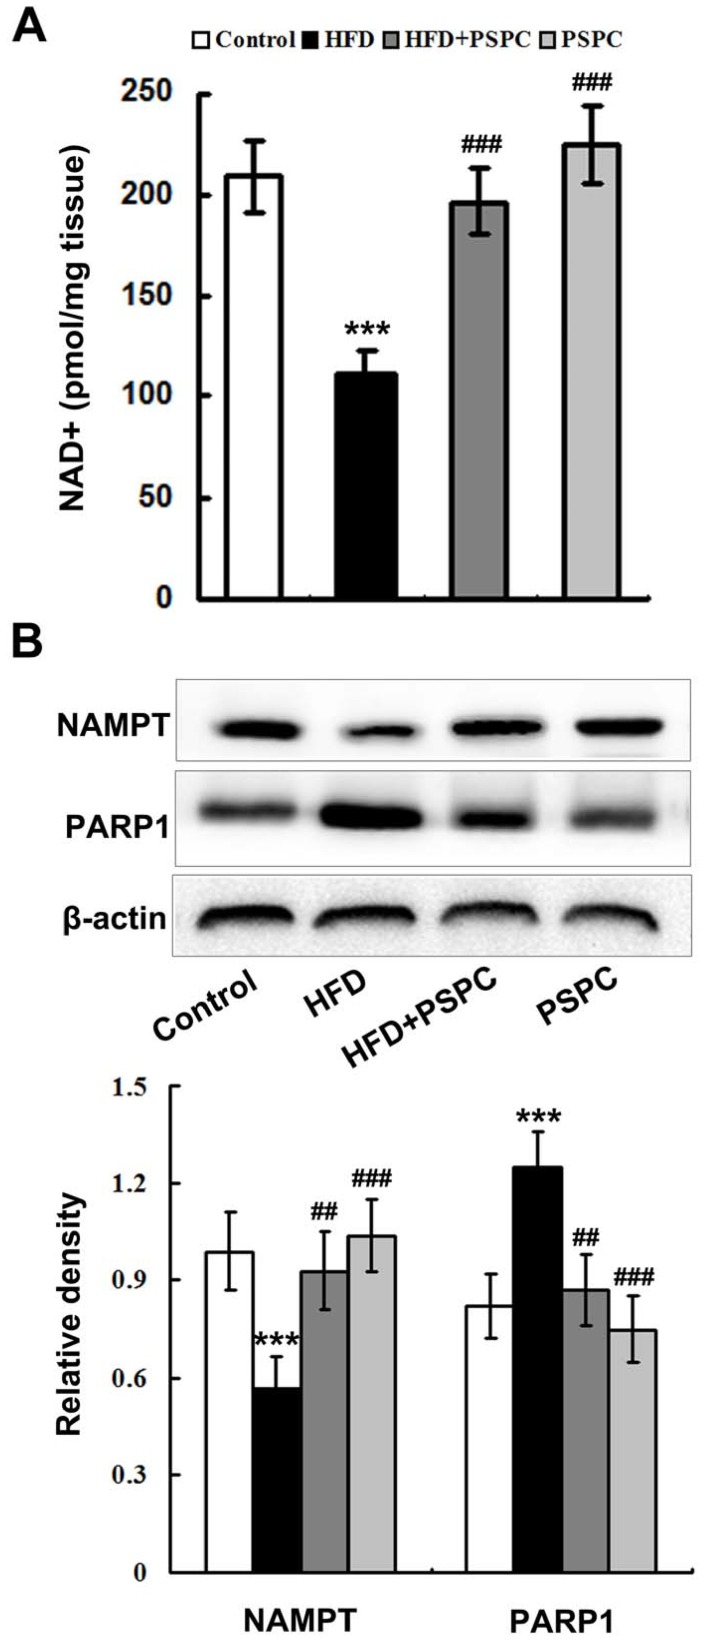
Figure 3.
PSPC restores NAD+ level in HFD-treated mouse livers. (A) Hepatic NAD+ levels in all treated groups (n = 5); (B) Immunoblotting and densitometry analysis of NAMPT and PARP1 in mouse livers (n = 3). All of the values are expressed as the mean ± SD. *** p < 0.001 vs. the control group; ## p < 0.01, ### p < 0.001 vs. the HFD group.

