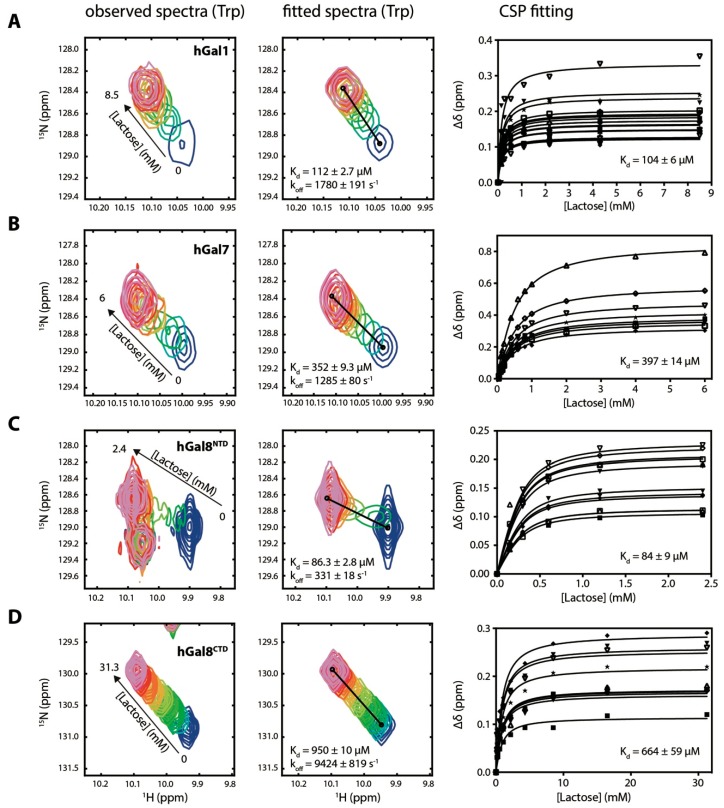
Figure 2.
Lactose titration of galectins monitored by NMR spectroscopy. Observed and fitted 15N-1H band-selective optimised-flip-angle short-transient heteronuclear single-quantum correlation (SOFAST-HMQC) spectra corresponding to the tryptophan indole resonances of (A) hGal1, (B) hGal7, (C) hGal8NTD, and (D) hGal8CTD are shown in the left and middle panels. The cross peaks are colour-ramped from blue to pink with increasing lactose concentration, as indicated by the titration points shown on the right panels with different final lactose concentrations as indicated by the arrows on the left panels. Details of the titration points are defined in Figure S1. Fitting results from TITAN program are indicated. Global fitting of the CSPs as a function of lactose concentration and the resulting Kd values for corresponding galectins are shown in the right panels. The titrations curves correspond to the residues that exhibit significant CSPs as defined in Figure 4, without severe overlaps throughout the titration to enable the calculations of individual CSPs at each titration point.

