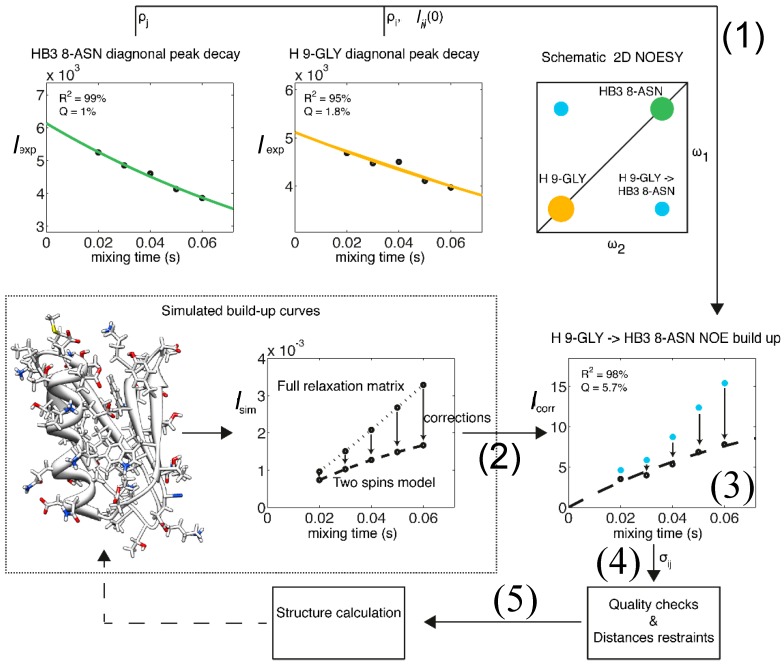
Figure 2.
Flow chart representation of the eNORA structure determination protocol using eNOEs. As an example, the eNOE originating from the amide H of Gly9 (spin i, orange) and enhancing Hβ3 of Asn8 (spin j, green) of GB3 is shown. (1) The diagonal-peak intensities derived from the NOESY spectra are fitted to mono-exponential decay functions to extract the auto-relaxation rate constants ρi and ρj, and the initial magnetizations, ΔMii(0) and ΔMjj(0); (2) A build-up curve taking into account all magnetization pathways is simulated with the full relaxation matrix approach. This simulation requires a 3D structure as input, which may be based on a conventionally determined structure with sufficient accuracy; (3) Corrections for the intensities at each mixing time are applied to the experimental NOE build-ups; (4) The NOE build-up intensity is fitted, the quality of the fit is evaluated, and upper- and lower-bound distance restraints are created; (5) A structure calculation is performed with the new distance restraints using established packages such as CYANA [39,40]. This structure may be used as an input for (2) in a new cycle, as indicated by the broken arrow. Adapted from [38] with permission from ACS, Copyright (2012).

