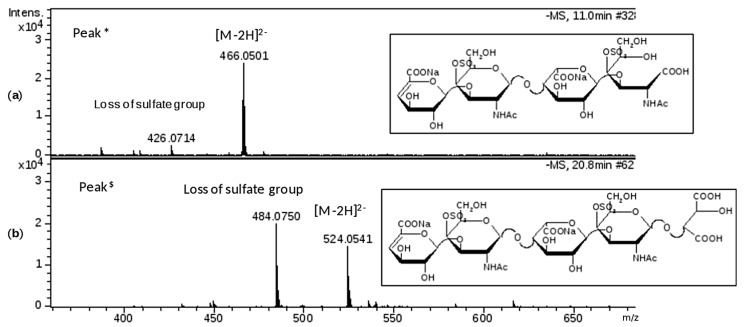
Figure 6.
Mass spectra of chromatographic peaks * and $, respectively (as labelled in Figure 5b) and corresponding to structures identified by MS/MS fragmentation experiment (data shown in supplementary material Figures S5 and S6): (a) fragment at m/z 466.0501 (z-2; M 934) attributed to ∆U4,2,2(T1); (b) fragment at m/z 524.0541 (z-2; M 1050) attributed to ∆U5,2,2(Ra). The substitution pattern of DS was used.

