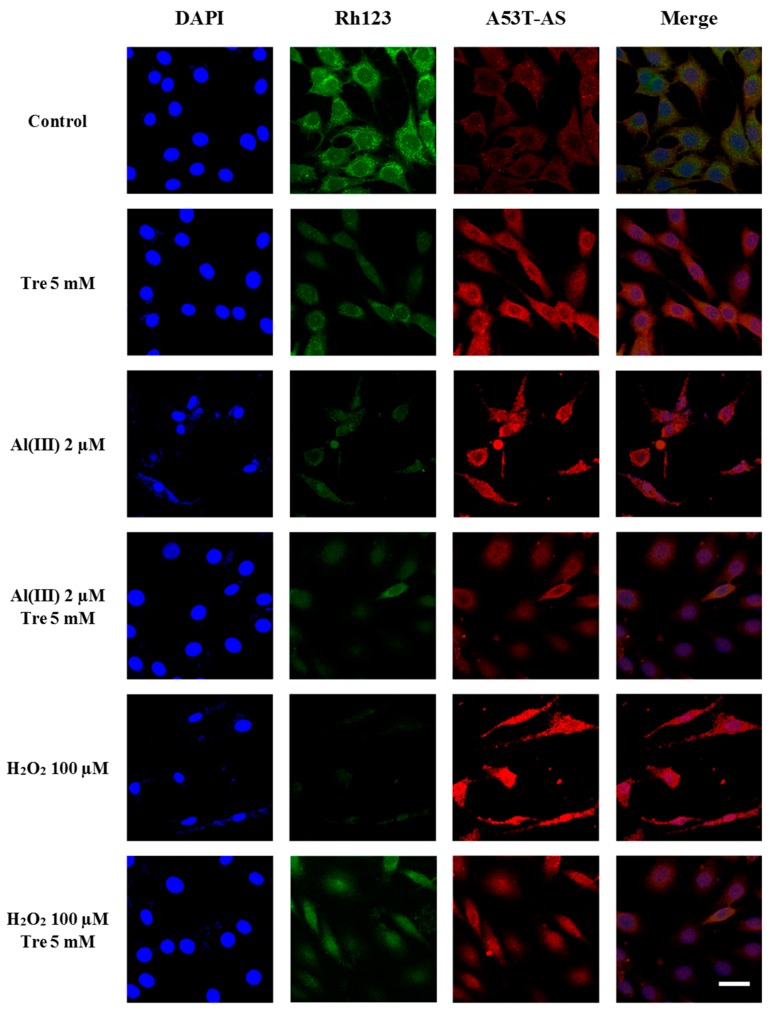
Figure 5.
LSCM images of a cell nucleus (blue, DAPI), mitochondria (green, Rh123), A53T-AS (red, rabbit anti-human AS antibody), and a combination of cell nucleus, mitochondria, and A53T-AS in transduced PC12 cells treated with and without 5 mM trehalose, 2 µM Al (III), 10 µM H2O2 and the combination of H2O2, aluminum and trehalose for 48 h, respectively. Scale bars = 20 µm. Every image shown is representative of three repeated experiments.

