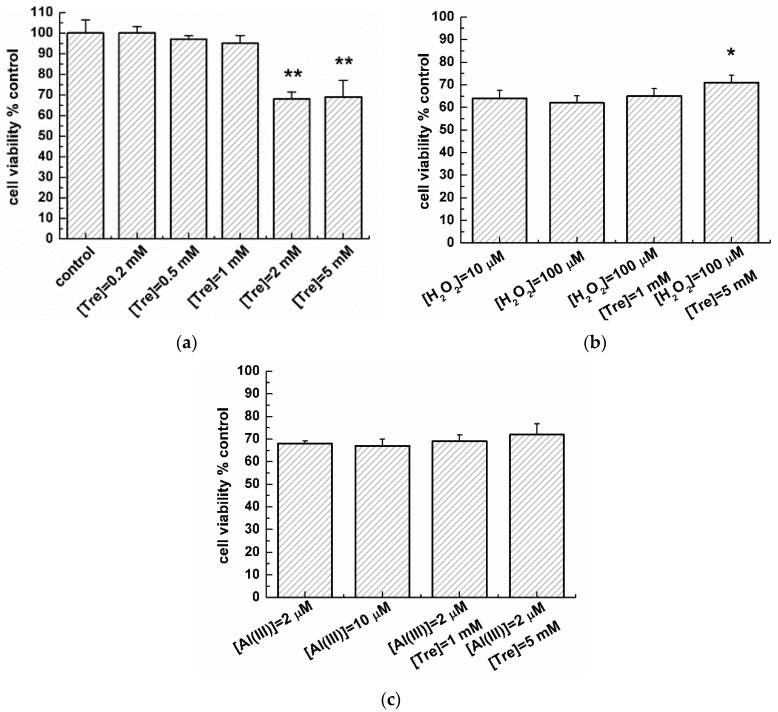
Figure 6.
Effect of trehalose on the viability of transduced PC12 cells by MTT assay. (a) Comparison of cell viabilities in the absence and presence of various concentrations of trehalose. Error bars = SD, n = 5, ** p < 0.01 vs. control group; (b) Cell viability with H2O2 or H2O2/trehalose mixture. Error bars = SD, n = 5, * p < 0.05 vs. 100 µM H2O2 group; (c) Cell viability in the presence of Al (III) or Al (III)/trehalose mixture.

