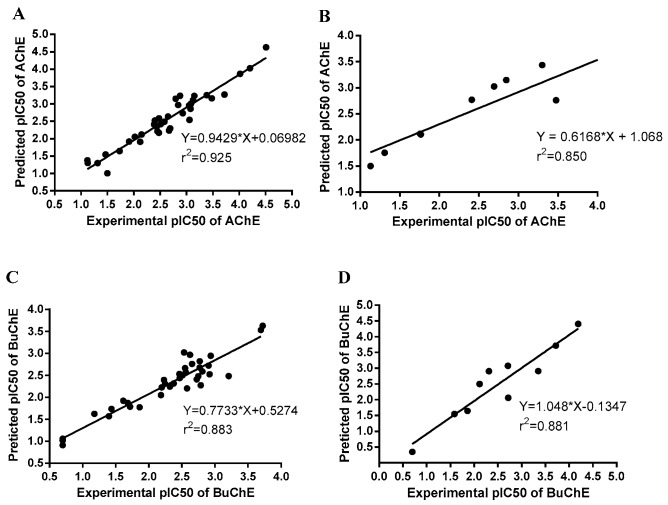
Figure 2.
Plot of the experimental versus predicted AChE and BuChE inhibitory activities of the training set and test set. The correlation coefficient R2 of AChE and BuChE 3D-QSAR models between determined and predicted activities of training set were 0.925 and 0.883 (A,C). The R2 of AChE and BuChE test set were found to be 0.850 and 0.881 (B,D), respectively.

