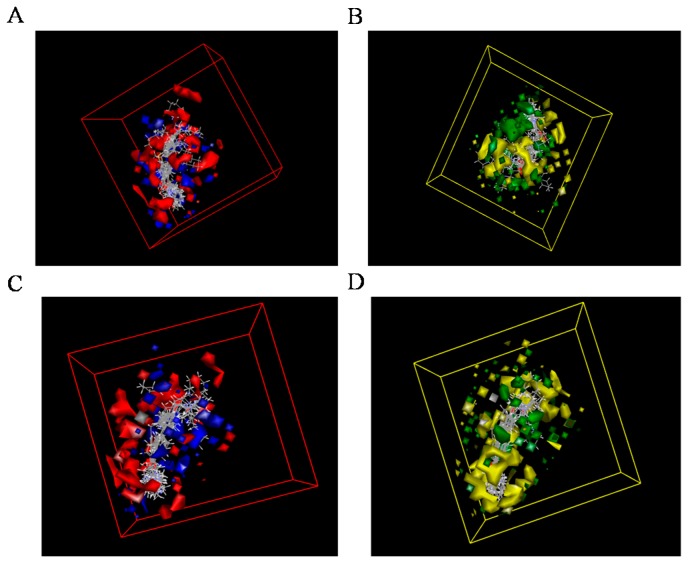
Figure 3.
3D-QSAR model coefficients on electrostatic potential and Van der Waals (VDW) grids. Figure A and B described the coefficients on electrostatic potential grids. Blue represents positive coefficients; red represents negative coefficients. (A: AChE, B: BuChE). Figure C and D presented the coefficients on VDW grids. Green represents positive coefficients; yellow represents negative coefficients. (C: AChE, D: BuChE).

